Category: Climate change

Rachel’s Journal Roundup Q1 2023

Rachel’s Journal Roundup Q1 2023

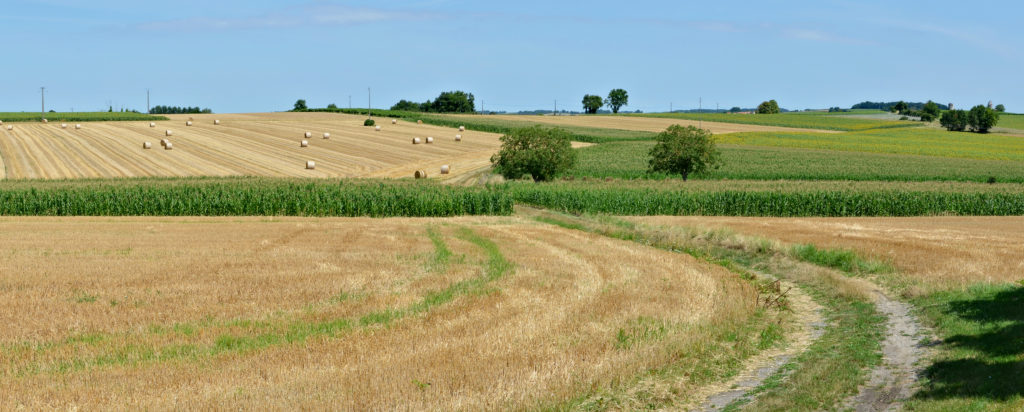
Climate Change and the Farm Business —

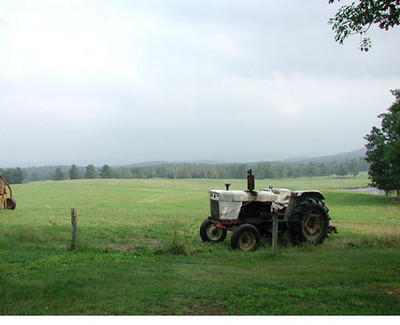
This article analyzes the effects of climate change on food production and farm income. Climate change is expected to exacerbate economic, environmental, and biotic (pests/diseases) uncertainties currently present in agriculture. More specifically, the primary focus of the article is the effect of climate variability, subsidies, and farming practices on the stability of food production and farm income. To accomplish this, the study used 929 farms as case studies across England and Wales between 2005-2017. The study found that variability in temperature and rainfall reduces the stability of farm income and food production. Although variability in climate can be largely outside of the farmers’ control, the authors’ findings indicate that proper farm management may be able to mitigate this effect.

The study found that farms with greater agricultural diversity had more stable income. Likewise, bigger farms were found to have greater financial stability due to both economies of scale and greater soil diversity. Climate conditions were found to affect the stability of both farm income and food production. Subsidies, meanwhile, were found to have a minimal impact on the stability of farm income. The study also found that more concentrated farms (those that spend more on fertilizer, pesticide, and concentrated animal feed) had less income stability but more stable levels of food production. Moreover, the benefits of stable food production were found to benefit larger and medium size farms the most. Lastly, farms with high input expenditures were found to be less efficient, implying that although food production increased with more concentration, this did not correlate to additional income stability for farmers. The article recommends several policies to increase income stability without jeopardizing food production, such as reducing input use, diversifying agricultural output through the use of targeted incentives, and increased incentives for precision farming. 

Harkness, C., Areal, F. J., Semenov, M. A., Senapati, N., Shield, I. F., & Bishop, J. (2022, November 24). Towards stability of food production and farm income in a variable climate. Ecological Economics. Retrieved March 10, 2023, from https://www.sciencedirect.com/science/article/pii/S0921800922003378
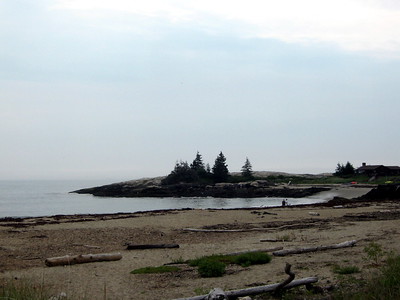

Coastal amenities and Sea level Rise

Igidae Coastal Trail.” by dombrassey is licensed under CC BY-SA 2.0.

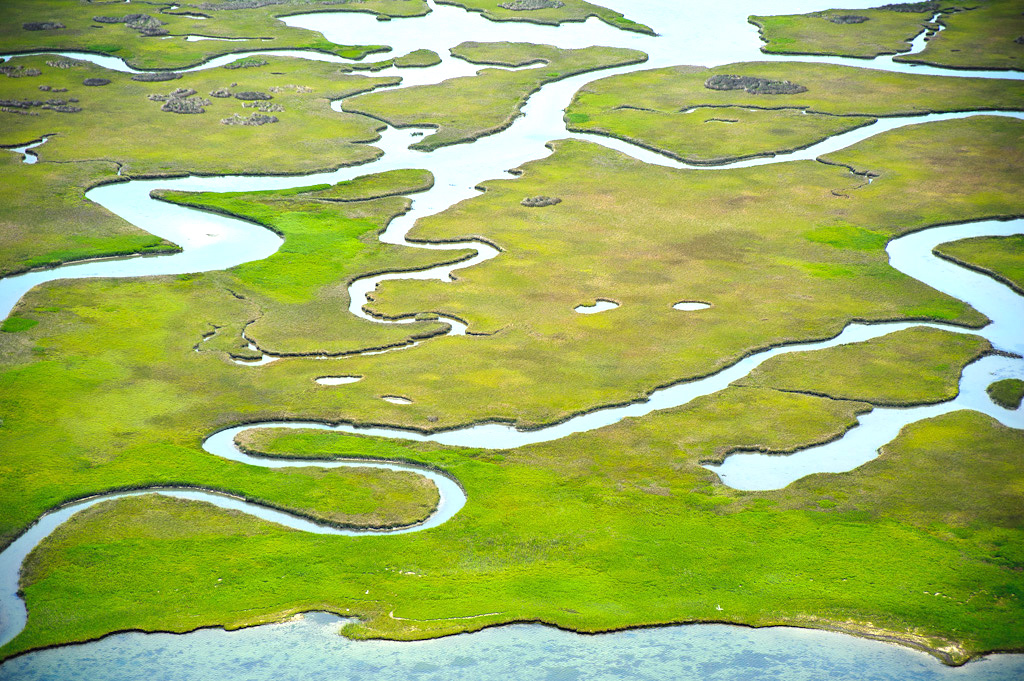
This article explores the economic value of the sea coast through airbnb comparisons (the price of coastal properties vs. inland properties) across 67 municipalities in the Balearic Islands, Spain. The authors choose the Balearic Islands to study due to its high property value and high erosion risk. The study then discusses how climate change has affected coastal assets, and how action will need to be taken to reverse this trend. Although the study takes place across the Atlantic, the results are applicable in the United States due to the universal fact that humans (especially tourists) value coastal properties, and climate change is of course not limited to coastal Spain. 

The study finds that Airbnb guests are willing to pay a premium for beach length, the presence of vegetation, the type of coastal frontage and whether the beach is in an urban environment. Meanwhile, the type of sand on a beach has virtually no effect on Airbnb prices. The study also mentions the importance of beach width, which by itself does not add much to the beach aesthetic, but provides important resiliency to erosion. The article concludes by mentioning the obvious economic benefits these coastal premiums provide for local communities, and their risk of eroding over time. Measures will need to be taken to preserve not just the coastal value of the Balearic Islands, but coastal areas across the world. 

Boto-Garcia, D., & Leoni, V. (2022, October 1). The Economic Value of Coastal Amenities: Evidence from Beach Capitalization Effects in Peer-to-peer Markets – Environmental and Resource Economics. SpringerLink. Retrieved March 8, 2023, from https://link.springer.com/article/10.1007/s10640-022-00735-5 


The Value of Dam Removals

This article examines the pros and cons of dam removal in Maine. On one hand, removing a dam  may enhance wildlife by allowing fish passage. On the other hand, dams can provide recreational and economic value to residents, and are even part of local historical identities. Current academic research is largely split on the topic, indicating that there is no general consensus on the issue of dam removal. Furthermore, the process for removing a dam is relatively complex. To study the effect of dam removal, the authors use 75 case studies – the largest sample size to date, and conclude that dam removal has a minimal impact on home value except for properties that are extremely close to the dam in question (100 meters or less). 

Ultimately, the authors believe that dam removal would be beneficial for the environment with minimal economic cost. A limitation of this study is that it focused primarily on rural areas, so the results may not be applicable to urban and suburban environments.

Guilfoos, T., & Walsh, J. (2022, October 7). A Hedonic Study of New England Dam Removals. Ecological Economics. Retrieved March 8, 2023, from https://www.sciencedirect.com/science/article/pii/S0921800922002853 


Marine Tourism Levies?–  

This article outlines the need to adopt a behavioral approach built around marine conservation, specifically a tourism levy, whereby tourists would pay a premium when visiting (and using) the oceans of local communities. Unlike past proposals, whereby the revenue collected would be directly invested into local marine conservation efforts, the authors argue that since tourism is not heavily present in the global south (which would benefit the most from such a tax), the revenue from such a tourism levy should go towards a global marine conservation effort. The article surveys tourists to see if such an idea could work in practice.  The results found that support for a “tourism levy” depended heavily on income and already present beliefs on the environment. Moreover, the study was limited to English speakers, as well as skewed towards wealthier tourists. As such, it is still hard to assess how practical a tourism levy would be. However, it is undeniable that action needs to be taken to address the degradation of marine ecosystems and wildlife. Overall, this article discusses a potential market solution to the proven “commons” problem of marine degradation. 

Booth, H., Mourato, S., & Milner-Gulland, E. J. (2022, August 6). Investigating acceptance of marine tourism levies, to cover the opportunity costs of conservation for Coastal Communities. Ecological Economics. Retrieved March 9, 2023, from https://www.sciencedirect.com/science/article/pii/S0921800922002403 


Water Quality and Property Values–

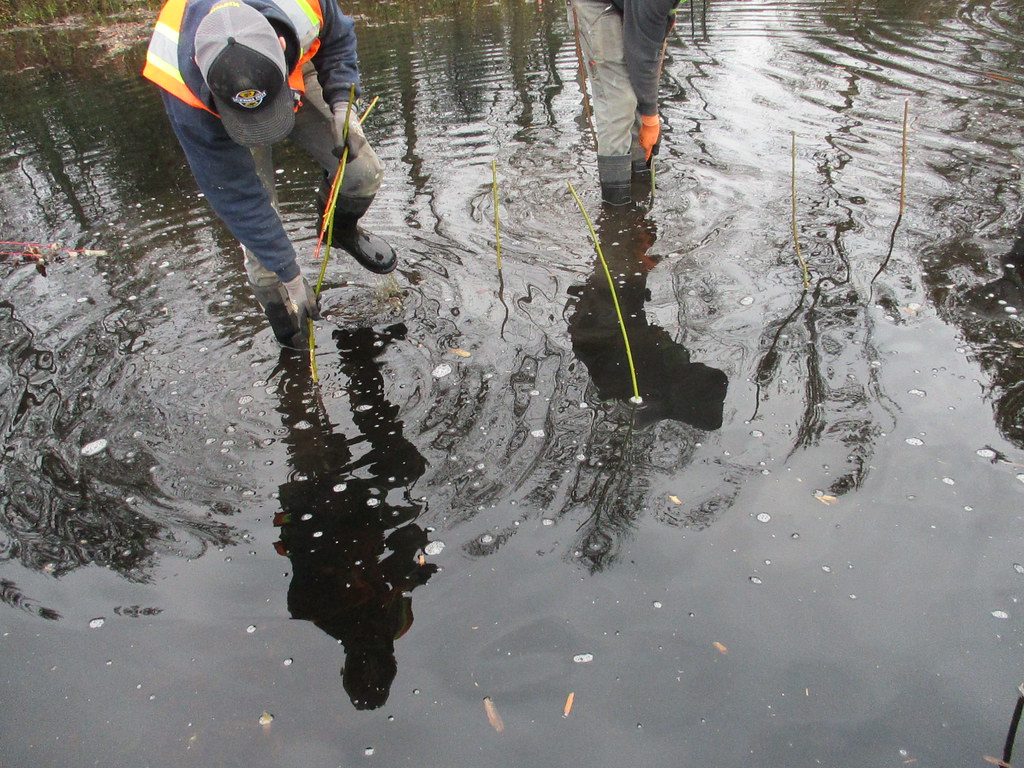
This article discusses the issue of water quality in the Chesapeake Bay. The Chesapeake Bay is the center of a multimillion dollar seafood industry – creating tens of thousands of jobs – and supports one of the largest property markets in the United States. However, despite recent improvements, declining water quality in the Chesapeake bay due to urban and agricultural runoff is putting these economic assets at risk. The article focuses on studying what, if any, correlation exists between water quality and home liquidity. The study collects data from properties within 2 km of the Chesapeake Bay and in either Anne Arundel, Baltimore, or Harford (all counties in Maryland) as well as the city of Baltimore. The authors explain the importance of this study by saying that a failure to account for the effect of water quality of home liquidity would result in policymakers underestimating the economic benefits of clean water – leading to a suboptimal outcome. 

The study found that clean water does correlate with higher home liquidity. The correlation increased the closer houses were to the Chesapeake Bay, but was present at all distances. This was determined primarily by sellers getting more for their homes with less time on the market compared to areas with lower water quality. Shorter listing periods are beneficial to sellers in the form of reduced stress and less holding expenses. Home prices were also higher for houses closer to the Chesapeake Bay. Overall, the study suggests that the benefits from water quality improvement are 13.3% higher when effects on liquidity are considered alongside property value increases. Overall, this study provides an important and underreported perspective on the economic benefits of improving water quality.

Irwan, N., & Wolf, D. (2022, May 25). Time is money: Water quality’s impact on home liquidity and property values. Ecological Economics. Retrieved March 10, 2023, from https://www.sciencedirect.com/science/article/pii/S0921800922001446


What is a Regenerative Economy?

What is a Regenerative Economy?

Does it mean biological means of production? While regenerative farmers are talking about high yields with no-till methods and soil biodiversity, some economists are talking about “a new vision for prosperity” that leaves behind the “rational man” of neo-classical economics for a new model of participation and dignity, one that meets the social needs of everyone while operating within the ecological limits of the planet. 

One of the most prominent voices for a regenerative economy is Kate Raworth, author of Doughnut Economics: Seven Ways to Think like a 21st  Century Economist. Raworth recently spoke at Schumacher Center for New Economics on the topic of Planetary Economics: New Tools for Local Transformation. In her talk last November to a record-breaking number of attendees for the Institute, Raworth suggested that transformation of the economy to save the planet is imperative and that the innovation we need is going to come from that bottom-up and be local. She is offering the Doughnut model as a guide and has launched the Doughnut Economics Action Lab as a collaborative toolbox for local economic renewal and participatory climate action.

The basic theory on Doughnut Economics focuses on a thriving future that emerges from balancing the ecological ceiling and the social foundation. The model has been adopted by over 40 cities and regions including Philadelphia, Amsterdam, Leeds, Barcelona, Mexico City, and Toronto. Place-based administrations and community coalitions around the world are using it as a way to reimagine and recreate the future in balance.

Raworth suggests that through multiple crises, humanity is awakening to an awareness of our profound interconnectedness with the living systems of Earth, and each other. Raworth’s idea for a regenerative and distributive economic reality is interesting. The framework borrows from the UN’s 17 Sustainable Development Goals to define the social foundation as the essential of life. The outside of the doughnut are the planetary boundaries defined by Roskstrom et al (2009). The planetary boundaries are what keeps life working on Earth. Raworth compares her doughnut to the dynamic circles of various Indigenous cultures around the world symbolizing health and wellbeing. She says that she is coming to see the doughnut as a “Western economic mindset recovery program”.  

We are paying attention to Doughnut economics because of the way that it embeds the economy within society and within the environment.

What does this mean for our clients and colleagues? We think that the model is useful as a holistic view for municipalities, civic organizations, businesses, trusts and finance. Whichever sector you are in, whether you’re in the visioning stage, looking for participatory tools for engagement or need just-in-time research or local impact analysis, we can help. Our consultants will partner with you to help you learn about the challenges of the changing world. 

Here are the eco-social and inventories areas of the doughnut. Contact us to learn more about the Doughnut or any of these parameters. Let us know if you are working on a Portrait of Place.

Ecological ParametersSocial Parameters
climate crisismobility / transportation 
load on the soilcommunity and connectedness
freshwater consumptionsocial participation and equality
loss of biodiversityhousing and energy
greenhouse gas emissionshealth and education
waste production, pollutionfood and water
deforestation and land use changework and income
air pollutionculture
peace and justice
political participation

Blog post is by Rachel Lyn Rumson


References

Rockström, J., Steffen, W., Noone, K. et al. A safe operating space for humanity. Nature 461, 472–475 (2009). https://doi.org/10.1038/461472a

Rachel’s Journal Roundup Q3 2022

Rachel’s Journal Roundup Q3 2022

  1. Theine,H.; Humer, S.; Moser, M.; Schnetzer, M. 2022. “Emissions inequality: Disparities in income, expenditure, and the carbon footprint in Austria,” Ecological Economics (197).

Recently, we completed a project for the Blue Hill Heritage Trust, where we estimated the economic, social, and environmental carrying capacity of the peninsula. One of the issues we considered was the environmental impact of those moving to the area. Like many areas in Maine, the Blue Hill region is seeing an influx of wealthier individuals to the area, primarily due to the rise of remote work. One question that was brought up for us is how households’ environmental impact changed with higher income levels. This article investigates the carbon content of households’ expenditure patterns. They find that the top decile of the income distribution in Austria receives 22% of national income, spends 18% of national expenditure, and causes 17% of emissions. The bottom decile, by contrast, accounts for just 3% of national income, 4% of expenditure, and 4% of emissions. While the article focuses on Austria, results are suggestive for the United States, where income inequality is much larger than it is in Austria. 

While differences in income may explain some of the differences in emissions, they only explain about one third of the difference, implying that the remaining two-thirds of the variation in emissions is attributed to other factors. Not surprisingly, results show that characteristics such as housing stock, heating fuel, and car dependence all contribute to the variation in household carbon emissions. 

These results are not surprising. However, they do bring up a question about the environmental footprint of households moving to Maine (and other places). If, as evidence seems to indicate, higher income people are moving to Maine, it may presage an increase in carbon emissions, based upon these results.  However, the potential good news is that two-thirds of the variation in emissions was due to other factors. If newcomers to Maine reduce their dependence on fossil fuels either by weatherizing or upgrading existing housing stock, they may be able to mitigate some of the increase in emissions coming from increased consumption. If public transportation can be improved in areas that are attracting in-migrants, so much the better. It is possible that an influx of in-migrants will increase carbon emissions. But it is not inevitable.

  1. Kovacs, K.; West, G.; Nowak, D.; Haight, R. 2022. “Tree cover and property values in the United States: A national meta-analysis.,” Ecological Economics (197).
Tree canopy” by Jim Stanton is licensed under CC BY 2.0.

This article explores the relationship between tree coverage and property values. The authors refer to tree coverage as a public good because increased tree coverage in a given area of a neighborhood has been shown to increase value of the homes throughout the entire neighborhood. A representation of this relationship would help municipalities quantify the benefits of community forestry programs. 

The hedonic property value method is a statistical technique that can be used to assess the value of ecosystem services to property. However, these studies are expensive and time-consuming, and oftentimes, local governments are unable to access the resources needed to carry out these analyses. The authors used hedonic property studies conducted in the past to create a benefit transfer tool (whereby multiple hedonic analyses are combined in a meta-analysis) that can be used to measure the value of tree coverage in communities that have not yet conducted hedonic property value analyses. 

Results indicate that where existing tree cover is low, increasing on-property tree density increases property values, while increases in off-property tree cover has no statistically significant effect. In contrast, where tree cover is medium to high,, off -property tree cover has a greater positive effect on property valves than on-property tree cover. This perhaps reflects the belief that high density tree cover on the property is seen as increasing maintenance costs. 

Although the study finds relatively low property value effects, increases in property values are only a small part of the benefits of increased tree cover. The ecosystem services provided by tree cover include air filtration, soil stabilization, flood control, recreation, and habitat provision, as well as aesthetic value. The authors conclude by noting that hedonic property studies can also be used to support open space zoning and green space ordinances.

  1. Mueller, J. 2022. “Natural Resource Dependence and Rural American Economic Prosperity From 2000 to 2015,” Economic Development Quarterly 36(3):160–176. 

This article investigates the role that natural resources play in the economic development of US counties. There are two types of natural resource development: extractive natural resource use, such as oil and gas, mining, and timber, and non-extractive, such as tourism, recreation, and real estate. The author points out that dependence on natural resource development has been shown to be associated with decreases in per capita income, increases in inequality, and elevated poverty in the long term (the so-called “resource curse”). Yet not as much attention has been paid in the literature to the dependence on non-extractive natural resource development. This study aims to correct that, by studying both forms of resource development on economic outcomes in rural counties across the United States. The author makes a distinction between remote rural counties and metro-adjacent rural counties. 

The author finds that the relationship between natural resource development and economic prosperity varies between non-metropolitan remote and nonmetropolitan metro-adjacent counties. Generally speaking, high levels of dependence on either extractive or non-extractive resource development was associated with negative economic outcomes for both remote and metro-adjacent rural counties. However, these relationships were complex. Non-extractive resource development in particular has been promoted in some strands of the literature to have a positive effect on economic outcomes in rural areas. But this work casts doubt on that hypothesis, indicating that non-extractive resource development may actually have a negative effect on the economic outcomes of remote rural counties, perhaps due to the low wages in many of those industries. More work needs to be done in this area.

Assessing the Carrying Capacity of the Blue Hill Peninsula

Assessing the Carrying Capacity of the Blue Hill Peninsula

What trends in Maine (unceded Wabanaki Territory) are threatening conservation of the farmland, forests, wetlands, and wildlife habitat that is needed to sustain ecological and community health in a changing climate?

As our communities attract more and (perhaps more urban and wealthier) households, how will the influx affect the capacity of our communities to sustain itself?

regional carrying capacity measures are social, economic and physical

The team at rbouvier consulting recently completed a study: “Assessing the Carrying Capacity of the Blue Hill Peninsula,” looking at just that. The project was done at the request of Blue Hill Heritage Trust (BHHT), a conservation organization that is shifting the meaning of conservation from recreation and scenic preservation to working lands and community use. BHHT uses outreach and education to increase the chances of fulfilling their mission: “to lead in conserving land, water, and wildlife habitat on the greater Blue Hill Peninsula; to teach and practice a stewardship ethic; to promote ecological, economic, and community health for this and future generations” (BHHT, 2022). The study looks at the current trends of climate and covid migration impacting the communities of the Blue Hill, Brooklin, Brooksville, Castine, Deer Isle-Stonington, Penobscot, Sedgwick, and Surry. 

Want to know what we found?

For this research, rbouvier consulting looked at two specific trends: 1) pandemic-related population trends and climate-related migration trends, trends that have the potential to impact the entire state.) Our charge was specifically to to the following:

  1. Assess the extent of COVID-19-related migration on the peninsula and its impacts.
  2. Investigate if climate migration is happening on the peninsula and what the future impacts may be.  
  3. Assess the carrying capacity of the Blue Hill Peninsula and the region’s ability to absorb an inflow of migration.

To assess how the COVID-19 pandemic impacted domestic migration patterns on the peninsula, researchers used change-of-address (COA) request data to quantify estimated change in population due to Covid-19. They identified the origins of movers to the project area, from 2018 to 2021 and determined the origins of migrating households. The findings show a clear overall increase in total COA requests (both permanent and temporary)  to the peninsula presumably due to COVID-19 (22%), with variable rates in each community, changing the trend from negative net population to positive. The group also looked at both school enrollment data and housing prices to learn more about the impacts on migration locally. Findings include:

  • Both temporary and permanent migration spiked in March 2020. Compared to March 2019, permanent COA requests were up over 53%, while temporary COA requests were up by almost 264%.
  • However, in 2021, those trends seem to have reversed, and net COA requests were once again negative, indicating that the population influx may not have been permanent.
  • Incoming COVID-19-related migration patterns reveal people moving to the peninsula were predominantly from outside of New England and from urban areas.
  • The number of building permits increased slightly, as did home sales and real estate prices.

To assess the impact of climate migration on the Blue Hill Peninsula our researchers were concerned with assessing a) if climate migration is occurring, and, if so, b) who is migrating and from where. To investigate these questions, we completed a literature review of climate migration studies, and inquired into national taxation data published by the IRS to compare filings before and after the pandemic. As part of our investigation, we compared migration trends with weather information for specific climate events and gleaned demographic information about climate migrants to the Blue Hill Peninsula. Further assessment was done to estimate the impact of this trend on housing, jobs, infrastructure and schools.

  • Households driving current climate migration trends have the financial wherewithal to move by choice to escape from perceived dangers (wildfires, flooding, hurricanes, or a pandemic).
  • The households that migrated to Hancock County in 2020 had an average income that was 20% above the average household income for the county in 2019.  

For this study, rbouvier consulting defined carrying capacity in terms of regional sustainability. Looking at regional analysis and tourism impact studies, we determined three interconnected component systems that simplify regional systems: a) physical, b) economic and c) social. With these three focus areas, we developed candidate indicators and screened those indicators for data availability and accessibility. Initial data collection focused on establishing a threshold level for each. With these indicators and baselines set, we evaluated each indicator against the threshold and were able to categorize each indicator with a rating scale based on levels of constraint on the system.  When we combine migration findings with carrying capacity analysis, the findings reveal present and future constraints on the carrying capacity of the region as follows:   

  • The impact of a wealthier, more urban population may affect the carrying capacity of the peninsula. 
  • The wastewater treatment facility in Blue Hill is not likely to be able to withstand a significant increase in population. Moreover, the facility is at risk from sea level rise. 
  • Roads and schools are likely to remain unconstrained for the foreseeable future.
  • Land for development is already constrained, though it varies in each community.
  •  There appears to be enough land for farming, but to the extent it is being farmed is unknown. Preservation of farmland is already below  conservation targets. 
  • Both cost of living and housing affordability are likely to worsen, as is the economic inequality in the region. 
  • Social conflicts are likely to accelerate between long-term residents and new arrivals.

 Why is this work important?

We feel that this is exactly the kind of research that communities should have at their disposal while they are working on planning the future in uncertain times. The pandemic might have spurred  a spike in migration, but  climate migration seems to be an progressive trend, bumping up migration with each significant climate event. That is why we have begun to study the migration trends for Cumberland County. We expect to release our findings to the public soon. So, stay tuned for that. In the meantime, we have permission to share the study if asked. If you would like to read Assessing the Carrying Capacity of the Blue Hill Peninsula, please drop us a line.

Fourth quarter 2021 and first quarter 2022 journal roundup!

Fourth quarter 2021 and first quarter 2022 journal roundup!

This quarter, I focus on three recently published articles that highlight the value of environmental goods and services: regulations to combat the emerald ash borer, the value of agricultural land, and the value of wetland restoration. 

Hope, Emily; McKenney, Daniel; Pedlar, John; Lawrence, Kevin; MacDonald, Heather. 2021. “Canadian efforts to slow the spread of Emerald Ash Borer (Agrilus planipennis Fairmaire) are economically efficient.” Ecological Economics, vol. 188. 

Emerald ash borer” by NatureServe is marked with CC BY-NC 2.0, via Openverse.

The emerald ash borer is an invasive insect that kills most species of ash tree. Managing the spread of the pest can be very expensive, with inconsistent results. The United States Department of Agriculture has actually removed federal regulations designed to slow the spread of the emerald ash borer, citing the high costs and the uncertain benefits. Canadian agencies have likewise been attempting to determine whether the benefits of regulation exceed the cost. The authors developed a model simulating the spread of the emerald ash borer under various conditions, and then modeled the likely effect of different regulations on that spread. Finally, they determined the economic impact of the emerald ash borer by calculating the cost of removing trees in urban areas and replacing 50% of them. (They did not model the cost of insecticide application due to the complexity of modeling such application at a national level.) For rural areas, the authors calculated the cost of the emerald ash borer by using the stumpage value of the trees. 

Regulations designed to slow the spread of the emerald ash borer include limitations on transporting products containing wood from ash trees, treatments for products that are transported, and periodic audits. As the “true” efficacy of the regulations is unknown, the authors modeled the regulations at varying levels of efficacy. Finally, they then determined the net present value of the regulations. Results demonstrate that, even if regulations are only 25% effective at slowing the spread of the emerald ash borer, benefits outweigh the costs. This is the case even though the authors did not include the economic value of a healthy forest. If that were included, the benefits of those regulations would likely be much larger.

Agricultural landscape certification as a market-driven tool to reward the provisioning of cultural ecosystem services

Borrello, M.; Cecchini, L.; Vecchio, R.; Caracciolo, F.; Cembalo, L.; Torquati, B. 2022. Ecological Economics vol 193. 

File:Bessac 16 Polyculture 2013.jpg” by JLPC is marked with CC BY-SA 3.0.

One of the primary difficulties that agricultural landowners face is the high cost of keeping their land in agriculture, relative to other land uses. And yet, agricultural land provides benefits to society beyond just the value of the food produced on that land. It is a classic example of an environmental externality. This article examines the potential of issuing a “traditional agricultural landscape certification” for the preservation of olive groves in Italy. They found that such a certification commanded a price premium in the market, indicating that the cost to farmers of keeping their land in agriculture could be partially rewarded through the market. 

Richardson, M.; Liu, P.; Eggleton, M. 2022. “Valuation of Wetland Restoration: Evidence from the Housing Market in Arkansas,” Environmental and Resource Economics 81:649–683.

Planting live stakes in standing water” by WSDOT is marked with CC BY-NC-ND 2.0.

Continuing with the theme of valuing environmental goods and services, this article examined the value of wetland restoration (through the Wetland Reserve Program) by looking at the housing market in Arkansas. This article adds to the literature on the economic value of wetlands by looking at temporal variations in the housing market relative to the starting and ending date of wetland restoration projects. Therefore, rather than looking at the value of an already existing wetland, this article examines how improvements in wetland quality could impact surrounding property values. Their research finds a substantial increase in property values – an average of 6 to 10%!  They also find that the wetland size and type were likely to influence the magnitude of the effect, with forested wetlands having a larger positive impact on housing values than pond, lake, or emergent wetlands. Interestingly, open water wetlands had a much smaller effect than non-open water wetlands. The reasons why are unclear.

Infrastructure: It’s more than roads and bridges

Infrastructure: It’s more than roads and bridges

John Buie, CC BY 2.0 https://creativecommons.org/licenses/by/2.0, via Wikimedia Commons

Infrastructure seems to be the word of the hour. With Democrats and Republicans having spent a good portion of the year wrangling over the size and scope of the infrastructure plan, it seems that everyone is talking about it. But we at rbouvier consulting have a slightly different perspective on what the term “infrastructure” includes.

Most people think about infrastructure from a physical or manufactured perspective: roads, bridges, transportation systems, and the like. From an economist’s standpoint, infrastructure also includes the necessities of a well-functioning market: clearly defined private property rights, a robust and transparent legal system, a structure to support the flow of information, and even trust among market participants. 

Environmental and natural resource economists expand the definition of infrastructure to include natural capital: assets provided by nature that support and provide ecosystem services: carbon sequestration, soil stabilization, natural flood control, water filtration, and the like. Just like manufactured infrastructure, natural infrastructure provides the underpinnings of a well-functioning economy. Even more so than manufactured infrastructure, natural infrastructure is almost invisible, only coming to our attention when it fails. 

Part of this is because of the “public good” nature of infrastructure. Much infrastructure (though not all) is characterized by two qualities: non-excludability and non-rivalness. Non-excludability means that once the good is provided, it is very difficult to “exclude” others from partaking of that good. Non-rivalness means that once the good is provided, one more user can enjoy the good without affecting others’ use of the good. The difficulty here is that private companies have no incentive to provide goods with such characteristics. You cannot use the price to exclude people from participating in the good, and one more user does not affect others’ use of the good, both of which destroy the profit motive. That is why many public goods are provided by the government – think national defense, or the national highway system. (The highway system can be thought of as a congestible good: non-rival up to a certain point. Most goods run on a spectrum from pure private goods to pure public goods.)

Natural infrastructure faces a double whammy: not only is most natural infrastructure characterized by non-rivalness and non-exclusivity, it is also seen as freely provided by nature. In our market-based society, things that are seen as freely available are also likely undervalued. In turn, things that are undervalued are not well managed. Just like physical infrastructure, natural infrastructure can be degraded or even destroyed. But by taking account of the services provided by natural infrastructure, we can make better decisions that will improve the functioning of our economy, and save us a little money at the same time. 

Infrastructure can be roughly divided into two types: green infrastructure and gray infrastructure. Green infrastructure is what I have been referring to as natural infrastructure, while gray infrastructure is manufactured infrastructure. In many cases, natural infrastructure can provide the same service as gray infrastructure, while providing other environmental benefits and avoiding environmental costs.

Think about flood control. Part of the reason why recent hurricanes have become more economically costly in the past few decades is because the natural wetlands – the marshy interface between the ocean and the land – had been destroyed or degraded. Recently, there has been a lot of interest in restoring wetlands to protect property from storm surges that come from hurricanes or other storms. Not only would restoring those wetlands provide flood control services, but they also could provide other ecosystem services in the form of habitat for aquatic creatures and other sea life.    

Or, take stormwater filtration. One of the recent projects that we are working on here at rbouvier consulting is about nutrient pollution: excess nitrogen and phosphorus pollution from farms and urban runoff. Excess nutrients in water bodies can cause hypoxia, or “dead zones,” where algae growth from too many nutrients can lead to depleted oxygen levels in water.  Some states are allowing municipalities to receive “credits” for nutrient pollution reduction by restoring formerly degraded wetlands, which allows those wetlands to trap and filter out pollutants before they reach the river, ocean, or bay. 

Finally, some drinking water utilities are purchasing forested land in their watershed. By investing in this natural capital, water utilities may be able save on expensive filtration processes through the forests’ natural filtration services.      

Green infrastructure is not always a substitute for gray infrastructure; in many cases, it can be a complement to it. Regardless, the infrastructure bill that emerges from Congress should pay attention to both kinds of infrastructure: green and gray.

Tides, Taxes and New Tactics Report

Tides, Taxes and New Tactics Report

The Southern Maine Planning and Development Commission (SMPDC) has released their final report  Tides Taxes and New Tactics: Adaptation Planning for the Impacts of Sea Level Rise and Storm Surge . rbouvier consulting worked with SMPDC and GEI Consultants to review the impacts of sea level rise on the three Southern Maine towns of Kennebunk, York, and Wells. Rbouvier consulting assessed the economic and social impacts for each town and the people who reside there.

The results were presented to each town in a series of three virtual workshops.  After the presentation attendees were then able to make suggestions on ways to mitigate some of the impacts, and how they’d like to see those efforts prioritized. 

Assessments such as this provide towns and residents with the information they need to be better able to plan for, and potentially mitigate, the impacts of sea level rise. 

Defining Safety Levels for Particulates Could Hurt Your Health – and the Economy

Defining Safety Levels for Particulates Could Hurt Your Health – and the Economy

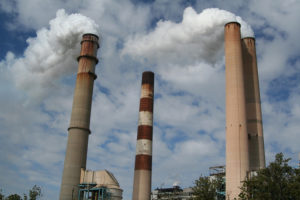
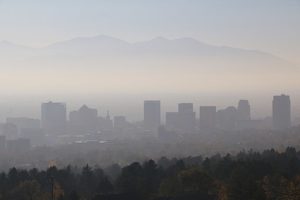
You’ve probably heard about some of the recent changes from the Environmental Protection Agency (EPA). But you might have missed the proposal about particulate matter (PM), since it didn’t get as much press. Or even if you saw it, you might not have recognized all the implications because they’re not immediately obvious.

This proposal is to define a safety threshold for what’s called PM 2.5, and it’s a reversal of the EPA’s prior stance. Until recently, the EPA said that no amount of particulate matter can be considered safe. Changing that could have serious impacts on our health – and the economy.

What is PM 2.5, and where does it come from?

Even if you’ve never heard of particulates, you’re likely familiar with them. These are the fine particles of liquids and solids that contribute to haze-filled cities and poor air quality. In fact, another name for PM is particle pollution.[1] This is because the tiny size allows these particles to get everywhere – including deep in your lungs.

PM 2.5 is a specific kind, named because the particles are only 2.5 micrometers in size. For comparison, an average human hair is 75 micrometers in width.[2]

These tiny materials are everywhere, coming from a number of places, including cigarettes and fireplace smoke. But the vast majority come from two sources:

–          50% is from industrial production, with 20% of that from coal-powered plants

–          35% is from gas-powered vehicles of all kinds[3]

Costs and benefits with current policy 

Under the current policy, with no level of particulate matter considered “safe,” any reduction of PM 2.5 below current levels is considered a benefit, and can be included in federal cost-benefit analyses.

In other words, if regulations to reduce greenhouse gases simultaneously reduce PM 2.5 (as they would, given that they share many of the same sources), that reduction counts as a co-benefit. And those co-benefits can play a significant role in the cost-benefit analysis of any proposed regulation to reduce greenhouse gases.

For example, the Clean Power Plan from the Obama era had an estimated $20 billion in climate benefits. But the benefits go up when you consider that the same technology used to reduce power plant emissions would also cut PM levels. Those changes result in an additional $13 to $30.3 billion in health benefits, effectively doubling the benefits.

Similarly, the Mercury and Air Toxics standards save $4 to $6 million by reducing toxins. And in this case, the co-benefit from reducing particulates is even higher, coming in between $37 and $90 billion.[4]

Proposed change reduces benefits

Now, under the proposed changes, lowering PM levels below the suggested “safety levels” won’t count as a benefit. After all, if anything below the threshold is already considered safe, bringing it down even further won’t be helpful.

This means that moving forward, climate change initiatives like the Clean Power Plan wouldn’t be able to factor in the lower levels of PM 2.5. And without that, the initiative might not get implemented, because the cost would be considered too high without the co-benefit to offset it.[5]

Damages from air pollution

 The impact on regulations is a concern, but those aren’t the only considerations. Air pollution already causes damages between $75 and $230 billion annually. And PM 2.5 contributes more to that than their size indicates.

Even though these particulates only account for 6% of emissions by weight, they cause 23% of the damages. The damages from PM 2.5 alone are between $17.25 and $52.9 billion annually. [6]

Health and economic impact

Most of the economic damage caused by PM 2.5 is due to increased health costs.[7] Health issues associated with PM 2.5 include:

–          Respiratory illnesses like bronchitis

–          Premature death

–          Low birth weight

–          Higher risk of asthma

–          Greater risk of heart disease

–          More instances of lung cancer

These conditions all carry increased economic cost. Some of this is a result of increased medical care, such as hospital visits and medication. [8]

But the costs also come from lost work time and reduced productivity. People who need to take time off for appointments and medical care won’t be as effective. Similarly, those who can’t breathe as well have less energy and will be less productive, even if they don’t require urgent care.

In addition, since particulates contribute to poor air quality, people might be more likely to stay inside. This means lost revenue from outdoor recreation and the potential of reduced health from lower levels of activity.

Poor air quality actually could have a negative impact on region’s workforce. Putting a priority on quality of life is becoming more common – including looking at factors like air quality. If an area has a distinct haze, or higher levels of respiratory conditions, people may choose to leave, or to not move there to begin with.[9]

Conclusion

While it’s impossible to identify all the effects of the EPA’s proposed safety threshold, it’s clear that the negative impacts could be far-reaching. Given that, the EPA and other agencies should take all of the risks into account before accepting a change that could cause such extensive damages to our environment, our health, and our economy.

Photo Credit:   Eltiempo10 [CC BY-SA 4.0], from Wikimedia Commons

[1] https://airnow.gov/index.cfm?action=aqibasics.particle

[2] http://www.sciencemag.org/news/2018/08/kill-climate-rule-trump-s-epa-wants-redefine-danger-soot

[3] http://www.rff.org/blog/2007/what-do-damages-caused-us-air-pollution-cost

[4] http://www.sciencemag.org/news/2018/08/kill-climate-rule-trump-s-epa-wants-redefine-danger-soot

[5] Ibid

[6] http://www.rff.org/blog/2007/what-do-damages-caused-us-air-pollution-cost

[7] Ibid

[8] https://www.brookings.edu/blog/jobs/2011/05/06/we-are-what-we-breathe-the-impacts-of-air-pollution-on-employment-and-productivity/

[9] https://www.forbes.com/sites/quora/2018/05/29/how-the-air-quality-where-you-live-might-be-affecting-your-health/#2881f8b37017

Is the proposed hybrid/electric vehicle tax a good idea?

Is the proposed hybrid/electric vehicle tax a good idea?

Photo: Robert Scoble

In February, Maine’s Governor LePage proposed implementing a fee on the owners of electric and hybrid vehicles.[1]  He is not alone – 17 other states have already implemented similar fees[2]).  It may seem, at first glance, to be yet another slap in the faces of “liberal-minded environmentalists.”  But giving the Governor the benefit of the doubt, it’s actually attempting to solve a problem that’s been seemingly intractable for years: that the state highway trust fund is overextended, at a time when the state’s infrastructure is badly in need of investment.

Maine, of course, is not alone. The Federal Highway Trust fund, which is primarily funded by federal taxes on gasoline, is also underfunded and over-extended.  Much like other issues in Congress, though, potential solutions seem to be few and far between, and no politician wants to propose anything as unpalatable as a tax increase.

So, what’s the problem? The highway funds at both the federal and the state level are funded primarily through taxes on gasoline.  In Maine, slightly less than 70% of revenues earmarked for the State Highway Fund are from gasoline taxes.  Another 27% come from vehicle registrations and fees, leaving the remaining 3% to come from various other sources[3].  In 1991, the first year for which revenue for the highway fund is reported on the legislature’s web site[4] , the highway fund received approximately $197 million (or approximately $363 million in today’s dollars).  In 2015, the fund received approximately $308.5 million (or $327 million in today’s dollars).  That’s a decrease of about 10% in real terms, despite the fact that the Association of Civil Engineers has given Maine a D on roads, essentially unchanged since 2008.[5]

Moreover, whereas the federal government has supplemented its declining revenues with other sources (with questionable legality), Maine cannot do the same. So how did we get in this mess?

The answer is that the tax is poorly targeted and creates perverse incentives.  Let’s start with the targeting question.  Taxes are supposed to do several things, from an economic viewpoint: raise revenue and change behavior.  In this case, the tax is primarily to raise revenue for the highway system.  Some environmentalists would also like to see the gasoline tax used to reduce the demand for and usage of gasoline, as one of the culprits in climate change, but the two objectives are fundamentally at odds, for several reasons.

First, if the revenue from a tax is used to fund a particular program, then the tax should be designed to bring in a sustainable amount of revenue year after year.  In this case, the revenue from the gasoline tax has been declining year after year. This decline is due to both technological advances and changes in demand.  Average fuel economy for passenger cars has been generally rising since 2000, and the trend has been similar for trucks since about 2004.  Average fuel economy for both cars now stands at about double what it was in the 1970s, meaning today’s cars can travel twice the mileage on a tank of gas than they could back in the 70s[6].  That’s great news for the environment, but not great news for those who depend upon the revenue from the gas tax.

Second, even as the Maine population increases, the number of miles driven has not increased.  In fact, whereas you normally might expect to see people driving more miles as it becomes cheaper to do so, we aren’t seeing such a trend.  In fact, while Mainers drove about 14,925 in 2005, that number actually dropped to 14,838 in 2016[7]. So, the revenue from the gas tax has been hit doubly hard: the average miles per gallon has increased, while the number of miles driven per year has decreased.  We could of course increase the gasoline tax (it hasn’t been increased since 2011), but that is likely to further dampen the demand for purchases of gasoline.

So, what to do?  We could, of course, follow Governor LePage’s recommendation and impose a surcharge on hybrid and electric vehicles. In one way, that would address the “free rider” problem that some analysts have pointed out: that owners of hybrid and other fuel-efficient vehicles use the highways as much as others, but don’t pay their “fair share” to the highway fund.[8]

Ultimately, though, that would not solve the problem, because the gas tax is poorly targeted in the first place.  The wear and tear on our infrastructure is tied to the usage of the highway, which is only imperfectly proxied by gallons of gasoline purchased.  A better targeted tax would be to impose a tax on vehicle miles driven, like the one currently being studied by the Colorado Department of Transportation. [9]  Of course, such a system would require some method of tracking number of miles driven, either through electronic monitoring such as those already in place on tolled highways, or through some other system.

Such a tax would not, of course, create an incentive for individuals to buy more fuel-efficient vehicles, which is one of the reasons why environmentalists like the gas tax.  The gas tax, in their mind, is akin to a cigarette tax, which aims to curb smoking by increasing the price.  But if the goal there is to reduce carbon emissions, a tax on the carbon content of fuel, not the gasoline itself, would be a more efficiently targeted tax.  But that’s a different blog post, for a different day. (You may view my blog posts on the carbon tax, here and here.)

[1] https://www.epa.gov/fuel-economy-trends/highlights-co2-and-fuel-economy-trends

[2] https://www.fhwa.dot.gov/policyinformation/statistics/2013/hm60.cfm

[3] http://www.thedrive.com/tech/18549/maine-and-colorado-struggle-to-tax-electric-cars-fairly)

[4] https://www.pressherald.com/2018/02/08/legislation-calls-for-new-annual-fee-on-all-electric-hybrid-cars-in-maine/

[5] https://www.greentechmedia.com/articles/read/13-states-now-charge-fees-for-electric-vehicles#gs.y_6lSMM

[6] http://legislature.maine.gov/legis/ofpr/highway_fund/pie_charts/Hfpie1213.pdf

[7] http://legislature.maine.gov/legis/ofpr/highway_fund/rev_exp_history/index.htm

[8] https://www.infrastructurereportcard.org/wp-content/uploads/2016/10/Maine-Report_Card_final_booklet.pdf

[9] https://www.denverpost.com/2017/12/12/colorado-mileage-tax-experiment/

Keeping the Lights On Doesn’t Mean More Pollution

Keeping the Lights On Doesn’t Mean More Pollution

Photo – Creative Commons/Flickr Amy the Nurse

In August of 2017, Energy Secretary and former governor Rick Perry proposed to strengthen subsidies to coal- and nuclear-fueled electricity plants.  Why?  According to his proposal, coal and nuclear power plants are indispensable to our national security by virtue of the fact that they can store energy on-site. And, since the past few years have seen declines in both coal and nuclear facilities in the United States, the concern is that the nation’s electricity grid will be less reliable in the future. The proposal would have guaranteed cost recovery and a fair rate of return for generators that can store at least 90 days’ worth of energy on site.  Fortunately, the Federal Regulatory Commission rejected it.  Even so, it’s still worth looking at the pros and cons of such a proposal.

More power outages and more disruptions would, of course, harm our energy-intensive economy. As the recent spate of hurricanes (including high winds in my home state of Maine) have shown, such energy disruptions can be costly. In fact, 2017 was the costliest year in terms of economic damages from natural disasters in the US.

Would subsidizing coal and nuclear facilities really have been the best solution? To answer that, we need to take a deeper look.  When I teach cost-benefit analysis, I encourage my students to consider the baseline – what would have happened in the absence of the policy or proposal in question. The number of coal and nuclear plants in this country has been declining for decades. The decline can be attributed to several factors, including environmental regulations, but mainly the declines are due to market forces (low electricity prices, declining electricity demand, and new supplies from natural gas) and aging infrastructure. Without taking a close look at the finances of the plants in question, we can assume that at least some of these plants would have been likely to follow.  Increasing subsidies to already struggling nuclear and coal plants would likely have been just another case of throwing good money after bad.

When considering the costs and benefits of the proposed plan, there would have been several different categories, each accruing to different groups.  The beneficiaries of the plan would likely have been owners and shareholders of the qualifying coal and nuclear plants.  Their consumers, as well, may have benefited from a lower average wholesale price of electricity; however, the proposal recommended adding a surcharge to consumers’ bills in order to cover the costs. According to the analysis done by Resources for the Future, the drop in the wholesale price of electricity would not have been enough to cover the surcharge.

Moreover, practitioners of cost-benefit analysis need to carefully consider all the costs and benefits of a proposal, not just those that are easily monetized.  A complete analysis of the costs and benefits of Secretary Perry’s proposal should include the damages caused by pollution from coal and nuclear-powered plants to humans and agriculture. (While the generation of electricity from nuclear plants does not create air pollution, the mining for uranium does create environmental destruction.) Such external costs are in reality a passive subsidy that coal and nuclear plants have enjoyed for decades. An additional subsidy would exacerbate the problem. According to the analysis done by Resources for the Future, the proposed plan would have immediately increased sulfur dioxide and nitrogen oxide, two pollutants generated by the combustion of fossil fuel.  This increase in emissions is linked to an increase in premature deaths caused by respiratory diseases such as chronic bronchitis and emphysema. Once environmental costs are factored in, net benefits to society would have been decidedly negative.

The next question is: would the subsidies have alleviated the problem of grid instability? The answer to this question actually lies in the question itself.  Is there really a problem of power disruption caused by declining coal and nuclear plants? Some recent research by the Rhodium Group says no.  Researchers examined the data collected by the Department of Energy whenever an electricity generator experiences an outage or a disturbance.  Results indicate that disruptions in fuel supply were responsible for less than 1 one hundredth of one percent of lost customer service hours between 2012 and 2016.  The remainder were caused by disruptions to energy distribution  Primarily, those disruptions were caused by severe weather, not by supply disruptions.  The FERC ultimately agreed when it rejected Secretary Perry’s proposal.

However, the FERC did agree that the reliability of the grid was an issue looking into.  If the goal of Secretary Perry’s proposal was to increase the reliability of the grid – not just to prop up nuclear and coal – there are several less costly and ultimately beneficial ways of doing so.  One such possibility is to replace our nation’s aging energy-related infrastructure, much of which dates to the 1950s and 60s. Energy infrastructure actually received a “D+” on the 2017 report by the American Society of Civil Engineers. Upgrading the energy infrastructure would come with many ancillary benefits.

A second alternative would be to invest in distributed energy and microgrids.  Distributed energy is the use of small, decentralized power generation and storage systems. While larger utilities consider the rise of distributed energy to be a threat to the existing system, the greater use of distributed energy could actually increase the resilience of our current, outdated system.  However, doing so will require innovations in monitoring, modeling, “smart switches,” and other technologies to manage peak demand and integration.

A third possibility is to invest in better long-term energy storage. Lithium ion batteries may be our best choice for now, but other storage technologies, such as flow batteries or zinc air batteries.  But by far the best alternative – one that should be a crucial part of any solution – is energy conservation.  A unit of energy conserved is one that doesn’t need to be generated.  You don’t get much more reliable than that.