Category: maine

Rachel’s Journal Roundup Q3 2022

Rachel’s Journal Roundup Q3 2022

  1. Theine,H.; Humer, S.; Moser, M.; Schnetzer, M. 2022. “Emissions inequality: Disparities in income, expenditure, and the carbon footprint in Austria,” Ecological Economics (197).

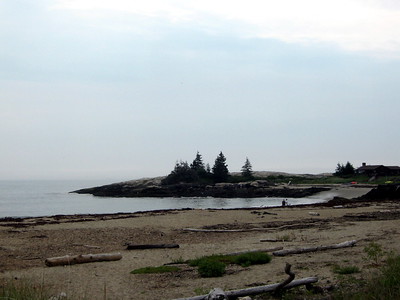
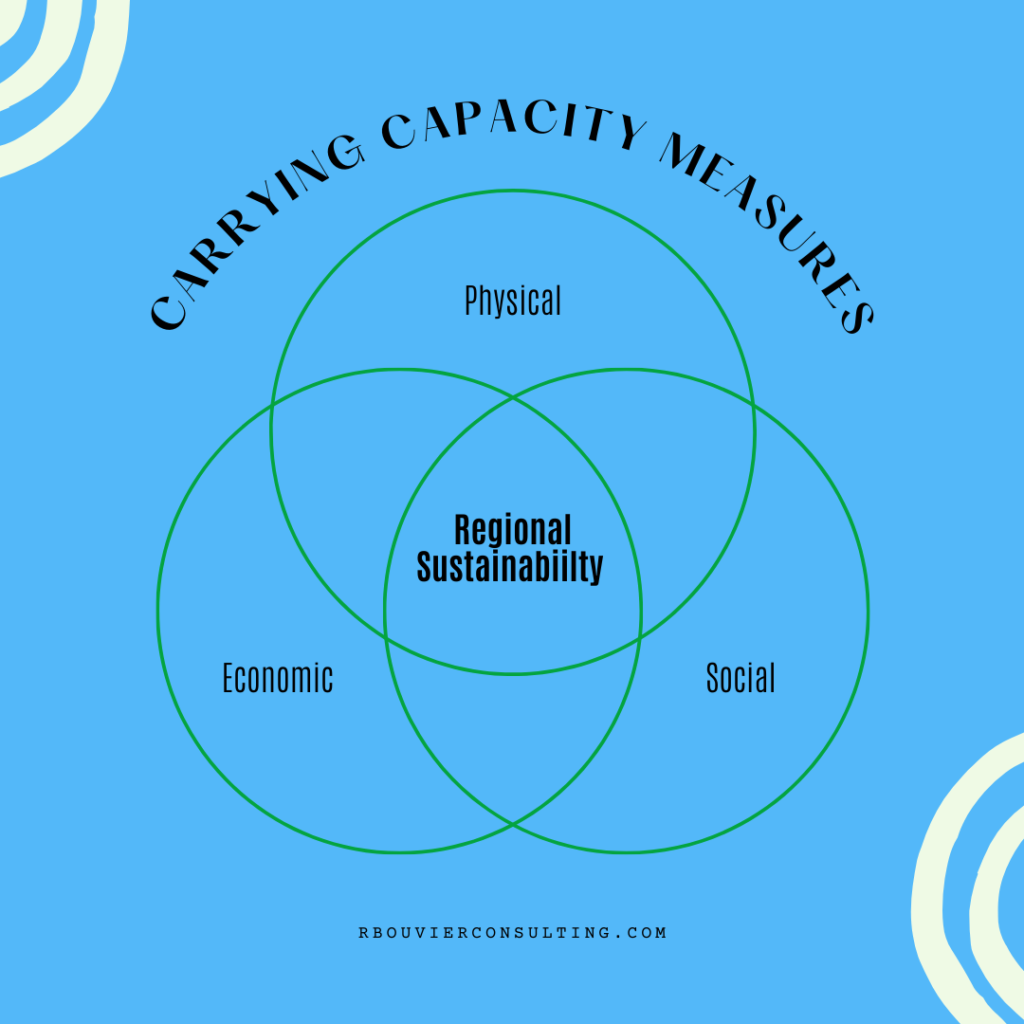
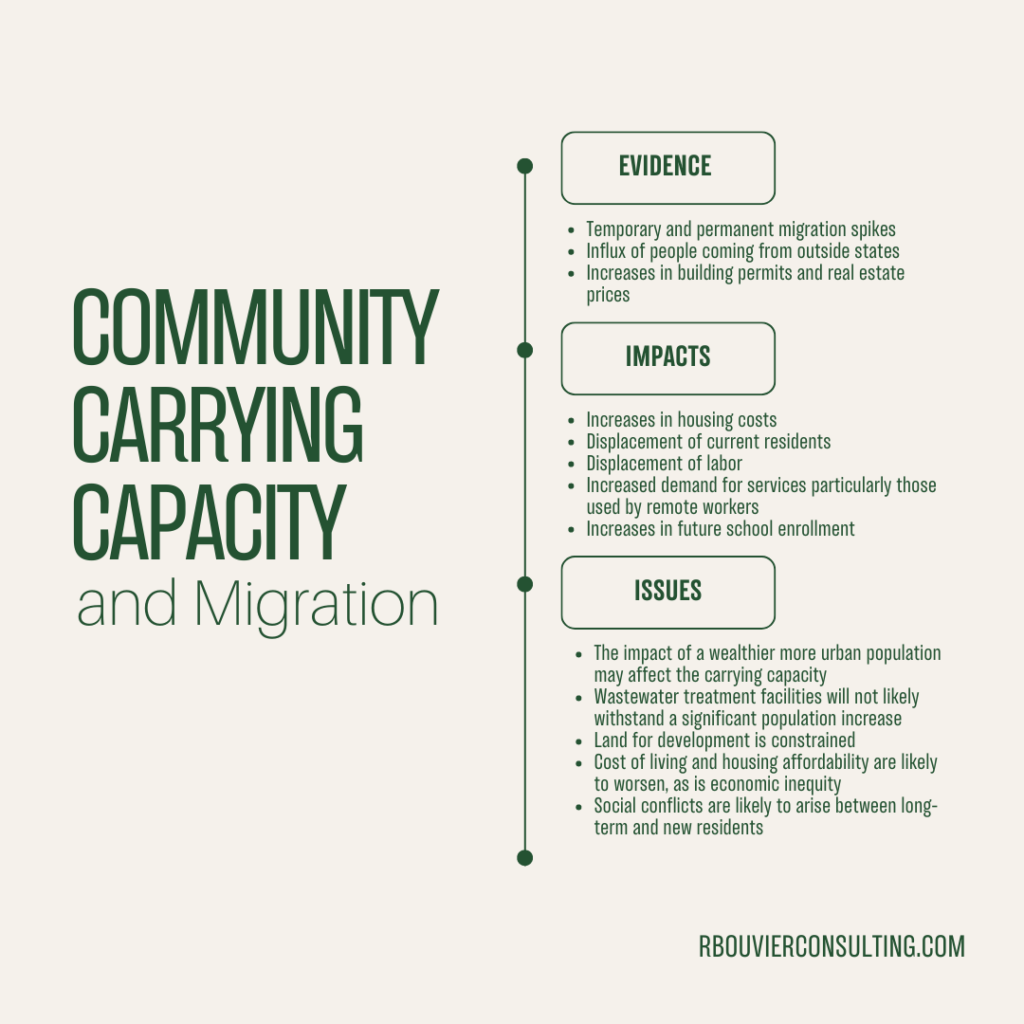
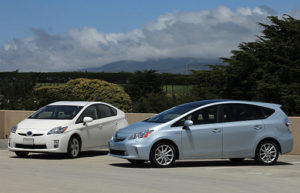
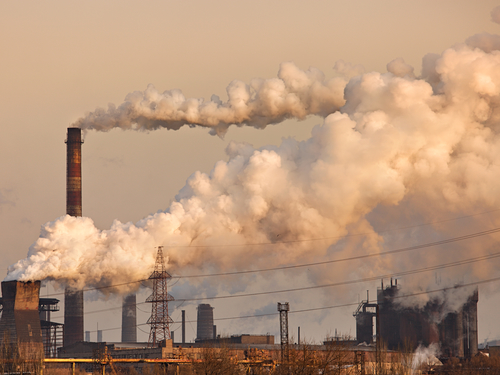
Recently, we completed a project for the Blue Hill Heritage Trust, where we estimated the economic, social, and environmental carrying capacity of the peninsula. One of the issues we considered was the environmental impact of those moving to the area. Like many areas in Maine, the Blue Hill region is seeing an influx of wealthier individuals to the area, primarily due to the rise of remote work. One question that was brought up for us is how households’ environmental impact changed with higher income levels. This article investigates the carbon content of households’ expenditure patterns. They find that the top decile of the income distribution in Austria receives 22% of national income, spends 18% of national expenditure, and causes 17% of emissions. The bottom decile, by contrast, accounts for just 3% of national income, 4% of expenditure, and 4% of emissions. While the article focuses on Austria, results are suggestive for the United States, where income inequality is much larger than it is in Austria. 

While differences in income may explain some of the differences in emissions, they only explain about one third of the difference, implying that the remaining two-thirds of the variation in emissions is attributed to other factors. Not surprisingly, results show that characteristics such as housing stock, heating fuel, and car dependence all contribute to the variation in household carbon emissions. 

These results are not surprising. However, they do bring up a question about the environmental footprint of households moving to Maine (and other places). If, as evidence seems to indicate, higher income people are moving to Maine, it may presage an increase in carbon emissions, based upon these results.  However, the potential good news is that two-thirds of the variation in emissions was due to other factors. If newcomers to Maine reduce their dependence on fossil fuels either by weatherizing or upgrading existing housing stock, they may be able to mitigate some of the increase in emissions coming from increased consumption. If public transportation can be improved in areas that are attracting in-migrants, so much the better. It is possible that an influx of in-migrants will increase carbon emissions. But it is not inevitable.

  1. Kovacs, K.; West, G.; Nowak, D.; Haight, R. 2022. “Tree cover and property values in the United States: A national meta-analysis.,” Ecological Economics (197).
Tree canopy” by Jim Stanton is licensed under CC BY 2.0.

This article explores the relationship between tree coverage and property values. The authors refer to tree coverage as a public good because increased tree coverage in a given area of a neighborhood has been shown to increase value of the homes throughout the entire neighborhood. A representation of this relationship would help municipalities quantify the benefits of community forestry programs. 

The hedonic property value method is a statistical technique that can be used to assess the value of ecosystem services to property. However, these studies are expensive and time-consuming, and oftentimes, local governments are unable to access the resources needed to carry out these analyses. The authors used hedonic property studies conducted in the past to create a benefit transfer tool (whereby multiple hedonic analyses are combined in a meta-analysis) that can be used to measure the value of tree coverage in communities that have not yet conducted hedonic property value analyses. 

Results indicate that where existing tree cover is low, increasing on-property tree density increases property values, while increases in off-property tree cover has no statistically significant effect. In contrast, where tree cover is medium to high,, off -property tree cover has a greater positive effect on property valves than on-property tree cover. This perhaps reflects the belief that high density tree cover on the property is seen as increasing maintenance costs. 

Although the study finds relatively low property value effects, increases in property values are only a small part of the benefits of increased tree cover. The ecosystem services provided by tree cover include air filtration, soil stabilization, flood control, recreation, and habitat provision, as well as aesthetic value. The authors conclude by noting that hedonic property studies can also be used to support open space zoning and green space ordinances.

  1. Mueller, J. 2022. “Natural Resource Dependence and Rural American Economic Prosperity From 2000 to 2015,” Economic Development Quarterly 36(3):160–176. 

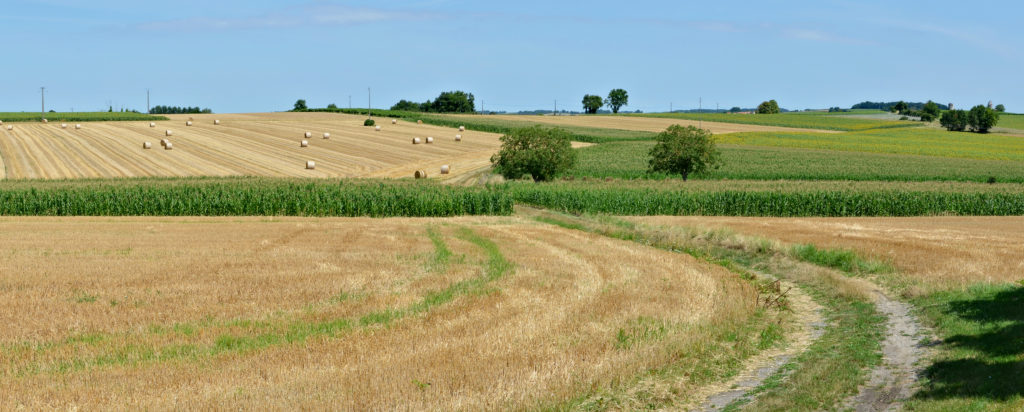
This article investigates the role that natural resources play in the economic development of US counties. There are two types of natural resource development: extractive natural resource use, such as oil and gas, mining, and timber, and non-extractive, such as tourism, recreation, and real estate. The author points out that dependence on natural resource development has been shown to be associated with decreases in per capita income, increases in inequality, and elevated poverty in the long term (the so-called “resource curse”). Yet not as much attention has been paid in the literature to the dependence on non-extractive natural resource development. This study aims to correct that, by studying both forms of resource development on economic outcomes in rural counties across the United States. The author makes a distinction between remote rural counties and metro-adjacent rural counties. 

The author finds that the relationship between natural resource development and economic prosperity varies between non-metropolitan remote and nonmetropolitan metro-adjacent counties. Generally speaking, high levels of dependence on either extractive or non-extractive resource development was associated with negative economic outcomes for both remote and metro-adjacent rural counties. However, these relationships were complex. Non-extractive resource development in particular has been promoted in some strands of the literature to have a positive effect on economic outcomes in rural areas. But this work casts doubt on that hypothesis, indicating that non-extractive resource development may actually have a negative effect on the economic outcomes of remote rural counties, perhaps due to the low wages in many of those industries. More work needs to be done in this area.

Assessing the Carrying Capacity of the Blue Hill Peninsula

Assessing the Carrying Capacity of the Blue Hill Peninsula

What trends in Maine (unceded Wabanaki Territory) are threatening conservation of the farmland, forests, wetlands, and wildlife habitat that is needed to sustain ecological and community health in a changing climate?

As our communities attract more and (perhaps more urban and wealthier) households, how will the influx affect the capacity of our communities to sustain itself?

regional carrying capacity measures are social, economic and physical

The team at rbouvier consulting recently completed a study: “Assessing the Carrying Capacity of the Blue Hill Peninsula,” looking at just that. The project was done at the request of Blue Hill Heritage Trust (BHHT), a conservation organization that is shifting the meaning of conservation from recreation and scenic preservation to working lands and community use. BHHT uses outreach and education to increase the chances of fulfilling their mission: “to lead in conserving land, water, and wildlife habitat on the greater Blue Hill Peninsula; to teach and practice a stewardship ethic; to promote ecological, economic, and community health for this and future generations” (BHHT, 2022). The study looks at the current trends of climate and covid migration impacting the communities of the Blue Hill, Brooklin, Brooksville, Castine, Deer Isle-Stonington, Penobscot, Sedgwick, and Surry. 

Want to know what we found?

For this research, rbouvier consulting looked at two specific trends: 1) pandemic-related population trends and climate-related migration trends, trends that have the potential to impact the entire state.) Our charge was specifically to to the following:

  1. Assess the extent of COVID-19-related migration on the peninsula and its impacts.
  2. Investigate if climate migration is happening on the peninsula and what the future impacts may be.  
  3. Assess the carrying capacity of the Blue Hill Peninsula and the region’s ability to absorb an inflow of migration.

To assess how the COVID-19 pandemic impacted domestic migration patterns on the peninsula, researchers used change-of-address (COA) request data to quantify estimated change in population due to Covid-19. They identified the origins of movers to the project area, from 2018 to 2021 and determined the origins of migrating households. The findings show a clear overall increase in total COA requests (both permanent and temporary)  to the peninsula presumably due to COVID-19 (22%), with variable rates in each community, changing the trend from negative net population to positive. The group also looked at both school enrollment data and housing prices to learn more about the impacts on migration locally. Findings include:

  • Both temporary and permanent migration spiked in March 2020. Compared to March 2019, permanent COA requests were up over 53%, while temporary COA requests were up by almost 264%.
  • However, in 2021, those trends seem to have reversed, and net COA requests were once again negative, indicating that the population influx may not have been permanent.
  • Incoming COVID-19-related migration patterns reveal people moving to the peninsula were predominantly from outside of New England and from urban areas.
  • The number of building permits increased slightly, as did home sales and real estate prices.

To assess the impact of climate migration on the Blue Hill Peninsula our researchers were concerned with assessing a) if climate migration is occurring, and, if so, b) who is migrating and from where. To investigate these questions, we completed a literature review of climate migration studies, and inquired into national taxation data published by the IRS to compare filings before and after the pandemic. As part of our investigation, we compared migration trends with weather information for specific climate events and gleaned demographic information about climate migrants to the Blue Hill Peninsula. Further assessment was done to estimate the impact of this trend on housing, jobs, infrastructure and schools.

  • Households driving current climate migration trends have the financial wherewithal to move by choice to escape from perceived dangers (wildfires, flooding, hurricanes, or a pandemic).
  • The households that migrated to Hancock County in 2020 had an average income that was 20% above the average household income for the county in 2019.  

For this study, rbouvier consulting defined carrying capacity in terms of regional sustainability. Looking at regional analysis and tourism impact studies, we determined three interconnected component systems that simplify regional systems: a) physical, b) economic and c) social. With these three focus areas, we developed candidate indicators and screened those indicators for data availability and accessibility. Initial data collection focused on establishing a threshold level for each. With these indicators and baselines set, we evaluated each indicator against the threshold and were able to categorize each indicator with a rating scale based on levels of constraint on the system.  When we combine migration findings with carrying capacity analysis, the findings reveal present and future constraints on the carrying capacity of the region as follows:   

  • The impact of a wealthier, more urban population may affect the carrying capacity of the peninsula. 
  • The wastewater treatment facility in Blue Hill is not likely to be able to withstand a significant increase in population. Moreover, the facility is at risk from sea level rise. 
  • Roads and schools are likely to remain unconstrained for the foreseeable future.
  • Land for development is already constrained, though it varies in each community.
  •  There appears to be enough land for farming, but to the extent it is being farmed is unknown. Preservation of farmland is already below  conservation targets. 
  • Both cost of living and housing affordability are likely to worsen, as is the economic inequality in the region. 
  • Social conflicts are likely to accelerate between long-term residents and new arrivals.

 Why is this work important?

We feel that this is exactly the kind of research that communities should have at their disposal while they are working on planning the future in uncertain times. The pandemic might have spurred  a spike in migration, but  climate migration seems to be an progressive trend, bumping up migration with each significant climate event. That is why we have begun to study the migration trends for Cumberland County. We expect to release our findings to the public soon. So, stay tuned for that. In the meantime, we have permission to share the study if asked. If you would like to read Assessing the Carrying Capacity of the Blue Hill Peninsula, please drop us a line.

Fourth quarter 2021 and first quarter 2022 journal roundup!

Fourth quarter 2021 and first quarter 2022 journal roundup!

This quarter, I focus on three recently published articles that highlight the value of environmental goods and services: regulations to combat the emerald ash borer, the value of agricultural land, and the value of wetland restoration. 

Hope, Emily; McKenney, Daniel; Pedlar, John; Lawrence, Kevin; MacDonald, Heather. 2021. “Canadian efforts to slow the spread of Emerald Ash Borer (Agrilus planipennis Fairmaire) are economically efficient.” Ecological Economics, vol. 188. 

Emerald ash borer” by NatureServe is marked with CC BY-NC 2.0, via Openverse.

The emerald ash borer is an invasive insect that kills most species of ash tree. Managing the spread of the pest can be very expensive, with inconsistent results. The United States Department of Agriculture has actually removed federal regulations designed to slow the spread of the emerald ash borer, citing the high costs and the uncertain benefits. Canadian agencies have likewise been attempting to determine whether the benefits of regulation exceed the cost. The authors developed a model simulating the spread of the emerald ash borer under various conditions, and then modeled the likely effect of different regulations on that spread. Finally, they determined the economic impact of the emerald ash borer by calculating the cost of removing trees in urban areas and replacing 50% of them. (They did not model the cost of insecticide application due to the complexity of modeling such application at a national level.) For rural areas, the authors calculated the cost of the emerald ash borer by using the stumpage value of the trees. 

Regulations designed to slow the spread of the emerald ash borer include limitations on transporting products containing wood from ash trees, treatments for products that are transported, and periodic audits. As the “true” efficacy of the regulations is unknown, the authors modeled the regulations at varying levels of efficacy. Finally, they then determined the net present value of the regulations. Results demonstrate that, even if regulations are only 25% effective at slowing the spread of the emerald ash borer, benefits outweigh the costs. This is the case even though the authors did not include the economic value of a healthy forest. If that were included, the benefits of those regulations would likely be much larger.

Agricultural landscape certification as a market-driven tool to reward the provisioning of cultural ecosystem services

Borrello, M.; Cecchini, L.; Vecchio, R.; Caracciolo, F.; Cembalo, L.; Torquati, B. 2022. Ecological Economics vol 193. 

File:Bessac 16 Polyculture 2013.jpg” by JLPC is marked with CC BY-SA 3.0.

One of the primary difficulties that agricultural landowners face is the high cost of keeping their land in agriculture, relative to other land uses. And yet, agricultural land provides benefits to society beyond just the value of the food produced on that land. It is a classic example of an environmental externality. This article examines the potential of issuing a “traditional agricultural landscape certification” for the preservation of olive groves in Italy. They found that such a certification commanded a price premium in the market, indicating that the cost to farmers of keeping their land in agriculture could be partially rewarded through the market. 

Richardson, M.; Liu, P.; Eggleton, M. 2022. “Valuation of Wetland Restoration: Evidence from the Housing Market in Arkansas,” Environmental and Resource Economics 81:649–683.

Planting live stakes in standing water” by WSDOT is marked with CC BY-NC-ND 2.0.

Continuing with the theme of valuing environmental goods and services, this article examined the value of wetland restoration (through the Wetland Reserve Program) by looking at the housing market in Arkansas. This article adds to the literature on the economic value of wetlands by looking at temporal variations in the housing market relative to the starting and ending date of wetland restoration projects. Therefore, rather than looking at the value of an already existing wetland, this article examines how improvements in wetland quality could impact surrounding property values. Their research finds a substantial increase in property values – an average of 6 to 10%!  They also find that the wetland size and type were likely to influence the magnitude of the effect, with forested wetlands having a larger positive impact on housing values than pond, lake, or emergent wetlands. Interestingly, open water wetlands had a much smaller effect than non-open water wetlands. The reasons why are unclear.

Taking the Measure of Plastic Bag Bans

Taking the Measure of Plastic Bag Bans

MichaelisScientists [CC BY-SA 4.0 (https://creativecommons.org/licenses/by-sa/4.0)]

Americans go through 102.1 billion plastic bags each year, and those bags end up everywhere. Whether they’re in whale stomachs, or in our water as microplastics, the volume has people concerned.

In an effort to reduce the amount of plastic, bans on single-use plastic bags are on the rise. California and New York already have state-wide bans, and Maine has just become the third state to do so. In other states, cities like Boston, Seattle and Chicago have their own bans, and more seem likely to follow.

While it’s popular to attack plastic bags, it’s still important to ask questions to make sure the bans are necessary and effective.

Are plastic bags as bad as people think? What are the alternatives, and are they any better? What impact do these bans have on people’s behavior and the environment?

It turns out that when you look at the whole lifecycle of different bags, and the unintended consequences of the bans, the results aren’t straightforward.

Cost of Bag Production

The environmental cost of production is a good starting point in measuring the impact of different bags. Contrary to what you might think, from this perspective, plastic bags win out.

Plastic bags are made by using ethylene. Ethylene   is a by-product of the crude oil refining process and natural gas production.   Manufacturing plants have also gotten very efficient at making plastic, so this process doesn’t generate many greenhouse gases per bag.

Paper bags, on the other hand, require cutting down trees and then processing them in an energy-intensive way. A 2005 Scottish study noted that paper bag production uses about four times as much water as plastic and creates three times the amount of greenhouse gases. It should be noted that in the United States, many paper manufacturing facilities use biofuels and co-gen systems to generate the power used in the manufacturing process which may mitigate some of these emissions.

Even cotton tote bags aren’t better for single use. This is because you need to factor in the land and water used to grow the cotton, as well as the processing and production. One study found that you’d need to use the tote bag at least 131 times to be better than a single-use plastic bag, based on the production impact.

Recycling and Decomposing

One of the biggest problems with plastic bags is what happens after they’re used. This is true whether they’re used once or a couple of times.

While the bags can technically be recycled, municipalities don’t accept them with other recyclables. This puts the burden on the consumer to save them and bring them to a place that will accept them, and most people don’t go to the trouble.

When plastic doesn’t get recycled, it either goes into a landfill or ends up as litter.

In a landfill, plastic takes an average of 500 years to decompose. The volume of these bags in the trash also comes at a cost. California alone spends $25M annually on disposal of plastic waste in landfills.

Paper, on the other hand, decomposes in just two to six weeks. It can also be easily recycled.

Other Impacts of Plastic in the Environment

Additionally, when plastic ends up as litter, the environmental impact is much worse than with paper.

Plastic has become one of the most common kinds of waste products, with much of it ending up in the ocean. A study from UC Santa Barbara found that each year, the world’s oceans receive almost 8 million metric tons of plastic.

As an example of how widespread this is, a recent dive by American explorer Victor Vescovo found a plastic bag at the bottom of the Mariana Trench, seven miles below the surface.

One of the biggest concerns with this is the impact on marine animals. Many are tempted to eat plastic bags, thinking they’re food, but instead the bags block their digestion.  As many as 1 million sea animals die each due to the plastic in the oceans. Among them was a dead sperm whale found in April 2019 with 48 pounds of plastic in its stomach.

A less publicized issue is the fact that plastic bags can cause problems in urban settings by clogging waterways and drains. This was discovered as one of the primary factors in flooding in Bangladesh in 1988 and 1998, which led them to ban plastic bags in 2002.

Microplastics are another concern. These form when the plastic breaks down into smaller and smaller pieces.

No one has enough evidence to show any specific health impacts of microplastics, mostly because it is unethical to ask human test subjects to ingest microplastics due to known health hazards of plastic in general, but the amount and range makes it worth watching. A 2017 study found that 94% of tap water samples from the United States contained microplastics and other studies have found high concentrations of microplastics in fish and shellfish commonly eaten by humans.

Another study also noted that when plastic bags are exposed to sunlight, they begin to give off ethylene, and continue to do so even after the sun sets.  This ethylene can contribute to the creation of atmospheric carbon monoxide, a greenhouse gas.  

.

These factors are what make the plastic bag bans so popular, even though from a production standpoint, they can do less environmental damage than the alternatives.

Considering Consumer Behavior

One issue that policymakers often overlook is how consumers will react to their policies. Production and disposal are only one part of the story. It’s also important to consider if people actually do reuse those bags, for what purpose, and how consumers will change their behavior after a plastic bag ban.

In some cases, people do use the plastic bags again, though often only one other time. The most common examples are to line small trash cans and to pick up after dogs. Those needs don’t disappear with the bans, and those are things you can’t use tote bags for.

As a result, one side effect of the bans is that people buy more trash bags for those purposes. Rebecca Taylor, an economist at the University of Sydney, saw a 120% increase in sales of small, four-gallon trash bags. From an environmental perspective, trash bags are worse than the single-use bags, since trash bags are thicker than grocery bags. This means they use more plastic, and it takes longer for them to degrade.

A quick glance at the comments section of the Portland Press Herald, in an article announcing the ban, revealed that many commenters were “hoarding” their plastic bags in response to the ban, or even buying rolls of plastic bags in advance of the law’s April 2020 effective date.

Additionally, the use of paper bags increases significantly after bans. A survey of a few areas in California found that paper bag usage jumped from 3% to 16%. This meant increased production for paper bags, as well as higher volumes of paper trash.

Still, the bans do encourage people to reuse bags by 40%. The bans also reduce the amount of plastic that ends up as trash, which is the other piece to consider.

Conclusion – It’s Complicated

Economists are notorious for responding “it depends” when asked a question comparing two alternatives.  The impact of bans on plastic bags is no different.  Depending on what you measure, you can find support for using plastic bags, and support for banning them.   

It’s important to remember that the impact doesn’t stop with the manufacturing. It continues with how the bags are used, and what happens with them when they’re no longer in use. It’s also important to recognize that no law is ever passed in a vacuum. We need to consider how people will respond, what alternatives are available to them, and what the unintended consequences may be.   

References:

January 8: Crafting an Economically Sustainable Working Waterfront

January 8: Crafting an Economically Sustainable Working Waterfront

Date:  January 8, 2019

Time: 4:00PM

Location:  Gulf of Maine Research Institute, 350 Commercial Street, Portland

Dr. Rachel Bouvier will be the featured presenter at the next Waterfront Alliance Meeting on Tuesday, January 9th.  She will be joined by other community members as part of a discussion on the topic:  Crafting an Economically Sustainable Working Waterfront.

FMI: https://www.waterfrontalliancemaine.org

Is the proposed hybrid/electric vehicle tax a good idea?

Is the proposed hybrid/electric vehicle tax a good idea?

Photo: Robert Scoble

In February, Maine’s Governor LePage proposed implementing a fee on the owners of electric and hybrid vehicles.[1]  He is not alone – 17 other states have already implemented similar fees[2]).  It may seem, at first glance, to be yet another slap in the faces of “liberal-minded environmentalists.”  But giving the Governor the benefit of the doubt, it’s actually attempting to solve a problem that’s been seemingly intractable for years: that the state highway trust fund is overextended, at a time when the state’s infrastructure is badly in need of investment.

Maine, of course, is not alone. The Federal Highway Trust fund, which is primarily funded by federal taxes on gasoline, is also underfunded and over-extended.  Much like other issues in Congress, though, potential solutions seem to be few and far between, and no politician wants to propose anything as unpalatable as a tax increase.

So, what’s the problem? The highway funds at both the federal and the state level are funded primarily through taxes on gasoline.  In Maine, slightly less than 70% of revenues earmarked for the State Highway Fund are from gasoline taxes.  Another 27% come from vehicle registrations and fees, leaving the remaining 3% to come from various other sources[3].  In 1991, the first year for which revenue for the highway fund is reported on the legislature’s web site[4] , the highway fund received approximately $197 million (or approximately $363 million in today’s dollars).  In 2015, the fund received approximately $308.5 million (or $327 million in today’s dollars).  That’s a decrease of about 10% in real terms, despite the fact that the Association of Civil Engineers has given Maine a D on roads, essentially unchanged since 2008.[5]

Moreover, whereas the federal government has supplemented its declining revenues with other sources (with questionable legality), Maine cannot do the same. So how did we get in this mess?

The answer is that the tax is poorly targeted and creates perverse incentives.  Let’s start with the targeting question.  Taxes are supposed to do several things, from an economic viewpoint: raise revenue and change behavior.  In this case, the tax is primarily to raise revenue for the highway system.  Some environmentalists would also like to see the gasoline tax used to reduce the demand for and usage of gasoline, as one of the culprits in climate change, but the two objectives are fundamentally at odds, for several reasons.

First, if the revenue from a tax is used to fund a particular program, then the tax should be designed to bring in a sustainable amount of revenue year after year.  In this case, the revenue from the gasoline tax has been declining year after year. This decline is due to both technological advances and changes in demand.  Average fuel economy for passenger cars has been generally rising since 2000, and the trend has been similar for trucks since about 2004.  Average fuel economy for both cars now stands at about double what it was in the 1970s, meaning today’s cars can travel twice the mileage on a tank of gas than they could back in the 70s[6].  That’s great news for the environment, but not great news for those who depend upon the revenue from the gas tax.

Second, even as the Maine population increases, the number of miles driven has not increased.  In fact, whereas you normally might expect to see people driving more miles as it becomes cheaper to do so, we aren’t seeing such a trend.  In fact, while Mainers drove about 14,925 in 2005, that number actually dropped to 14,838 in 2016[7]. So, the revenue from the gas tax has been hit doubly hard: the average miles per gallon has increased, while the number of miles driven per year has decreased.  We could of course increase the gasoline tax (it hasn’t been increased since 2011), but that is likely to further dampen the demand for purchases of gasoline.

So, what to do?  We could, of course, follow Governor LePage’s recommendation and impose a surcharge on hybrid and electric vehicles. In one way, that would address the “free rider” problem that some analysts have pointed out: that owners of hybrid and other fuel-efficient vehicles use the highways as much as others, but don’t pay their “fair share” to the highway fund.[8]

Ultimately, though, that would not solve the problem, because the gas tax is poorly targeted in the first place.  The wear and tear on our infrastructure is tied to the usage of the highway, which is only imperfectly proxied by gallons of gasoline purchased.  A better targeted tax would be to impose a tax on vehicle miles driven, like the one currently being studied by the Colorado Department of Transportation. [9]  Of course, such a system would require some method of tracking number of miles driven, either through electronic monitoring such as those already in place on tolled highways, or through some other system.

Such a tax would not, of course, create an incentive for individuals to buy more fuel-efficient vehicles, which is one of the reasons why environmentalists like the gas tax.  The gas tax, in their mind, is akin to a cigarette tax, which aims to curb smoking by increasing the price.  But if the goal there is to reduce carbon emissions, a tax on the carbon content of fuel, not the gasoline itself, would be a more efficiently targeted tax.  But that’s a different blog post, for a different day. (You may view my blog posts on the carbon tax, here and here.)

[1] https://www.epa.gov/fuel-economy-trends/highlights-co2-and-fuel-economy-trends

[2] https://www.fhwa.dot.gov/policyinformation/statistics/2013/hm60.cfm

[3] http://www.thedrive.com/tech/18549/maine-and-colorado-struggle-to-tax-electric-cars-fairly)

[4] https://www.pressherald.com/2018/02/08/legislation-calls-for-new-annual-fee-on-all-electric-hybrid-cars-in-maine/

[5] https://www.greentechmedia.com/articles/read/13-states-now-charge-fees-for-electric-vehicles#gs.y_6lSMM

[6] http://legislature.maine.gov/legis/ofpr/highway_fund/pie_charts/Hfpie1213.pdf

[7] http://legislature.maine.gov/legis/ofpr/highway_fund/rev_exp_history/index.htm

[8] https://www.infrastructurereportcard.org/wp-content/uploads/2016/10/Maine-Report_Card_final_booklet.pdf

[9] https://www.denverpost.com/2017/12/12/colorado-mileage-tax-experiment/

Economic Resiliency in the Face of Climate Change

Economic Resiliency in the Face of Climate Change

“Custom House Wharf Flooding at High Tide” by Corey Templeton is licensed under CC BY-NC-ND 2.0.

Climate change is expected to have a number of effects in Maine, including coastal flooding, sea level rise, and changing precipitation patterns, among others.  Many efforts are already underway to help protect communities from those effects, including zoning changes, new building requirements, armoring or elevating critical infrastructure, and the like. These efforts all fall under the heading “climate resiliency planning,” as they make a community more resilient to the disruptions wrought by changing weather patterns.

Ensuring that a local economy is resilient to climate disruption is nearly as important as physical resiliency. The local economy is a complex web of interactions between customers, workers, businesses, non-profits, and government agencies within the region. Economic resiliency planning can help to make sure that that web does not break – or, at least, is easily rebuilt – after a disaster.

Current approaches to assessing the impact of climate change too often ignore economic changes that are likely to occur.  Climate change poses physical threats to current businesses, true, but it also poses economic ones, as supply chains dry up, input prices rise, or competitive advantages shift. Focusing on preserving the economic status quo will do little good if advancing sea level rise and increasingly variable weather patterns result in a markedly changed economic landscape.

The first step in developing an economic resiliency plan for a local economy is to anticipate the likely physical changes that will accompany climate change, by taking a look at what areas of a particular municipality are likely to be impacted by certain events.  If you’re located on the coast, or if your town center is situated near a river, as is the case for many Maine towns, flooding from hurricanes or other large storms might be a priority.  Or, access may be more of an issue.  If your town has one or two main routes in and out of town, how likely are these routes to be block by high water, or by downed trees from wind damage? Many communities have already begun this work, through projections from the National Oceanic and Atmospheric Administration (NOAA) or from the United States Environmental Protection Agency.  Through this work, communities can get an idea of what physical assets are at risk from climate-related events.

Next, establish a baseline.  What are the largest employers in the municipality? What are the largest sources of tax revenue? What are the key industries, and what is the sectoral composition of the economic base? Where do most of the non-resident employers live, and what routes are they likely to take to work?  This will create a starting point to assess the local economy’s vulnerability to climate-related disruption.  The results may not always be what you think.

For example, many of Maine’s historically most important industries – agriculture, forestry, fishing, and tourism – depend heavily on the climate.  The output from these industries is likely to be directly impacted by any climate disruptions.  Agriculture, for example, could be both positively and negatively affected by climate change, as higher temperatures lead to a longer growing season, but also to increased need for irrigation.  These are the industries that are deemed “climate-sensitive in supply” by economists.

But there are also industries that are “climate-sensitive in demand” – where consumer demand for goods and services is likely to be affected by changing weather patterns or the physical effects that come with them.  Tourism, certainly, is one of these (both positively and negatively).  Energy is another.

Less obvious, perhaps, are the effects of underlying price changes and linkages between industries.  Let’s give an example.  Suppose that an increase in hot, humid weather in the northeast leads to increased demand for air-conditioning.  (Most areas in Maine now see fewer than four days a year when the heat index rises above 95 F, but that is predicted to change under most projections.)  The increased demand for air-conditioning will likely lead to increased electricity prices.  Those higher prices will ripple through the economy, affecting everything from family’s budgets to food prices to costs to businesses.

Finally, labor productivity might be affected by climate change.  Why? For those of us who have jobs in air-conditioned buildings, and as such are relatively shielded from the climate, the outdoor temperature might not affect our productivity.  But for the proportion of Maine workers who work outside, or do not have access to air conditioning, heat-related stress can be a factor, much as it is for livestock in Maine. Moreover, the effect of warmer temperatures on growing seasons works for pollen-producing plants as well, leading to increased rates of asthma and allergies. The spread of insect-borne diseases, such as Lyme, may affect productivity as well (not to mention impacting the health care sector).

Once the likely changes to the local economy are anticipated, policies can be put in place to help reduce risks.  Some of these policies might include encouraging local businesses to engage in disaster preparedness with others rather than in isolation, developing a directory of local businesses that can assist in rebuilding after a disaster, and identifying alternative procurement routes in case of a disruption in transportation infrastructure.

Planning for economic resiliency is less about rebuilding the day after a disaster, and more about planning so that economic disruptions are minimized should a disaster occur.  And it doesn’t have to be a stand-alone process.  In fact, it shouldn’t be.  Planning for economic resiliency should be integrated into planning efforts at all levels, from economic development to housing and infrastructure planning. While a disaster almost by definition is unpredictable, we do have the ability to anticipate the changes that will come with a changing climate.  We should take the time now to ensure that those changes don’t derail the local economy.

Can Maine benefit from mining?

Can Maine benefit from mining?

With Maine’s forested lands and iconic rocky shoreline, the notion that forestry and fishing were once the mainstays of Maine’s economy should come as no surprise to anyone familiar with the state. But mining?

Well, yes – although you wouldn’t know it from looking at today’s employment figures.  But in addition to the geological phenomena that endowed Maine with its rocky soil and many lakes,  Maine was also blessed with an abundance of minerals from volcanic activity – at least in certain areas. In the late 1800s, Maine experienced something of a mini-boom in metallic mining – mining for iron, silver, copper, and zinc. However, a sudden drop in prices led to the abrupt decline of the industry, and Maine did not experience much mining activity until World War II.

In the mid-1970s, however, increased mineral exploration led to the development of several important caches, mainly copper, zinc, and lead. Those deposits have not been mined – yet. Why? The answer is complicated, but it has to do (at least partially) with the Callahan Mine, near Brooksville, ME in Hancock County.  After the zinc and copper mine ceased operation in 1972, the area was found to be contaminated with polychlorinated biphenyls (PCBs), arsenic, and lead, among other heavy metals. The Environmental Protection Agency began a remedial investigation in 2004, with remedial action beginning in 2010. Clean-up is on-going, with passive treatment systems installed within the tailings impoundment and the removal of contaminated soils, either disposed of off-site or placed within a confined aquatic disposal (CAD) cell in another abandoned mine pit (Goose Pond). Full cleanup is expected to cost at least $23 million.

Unfortunately, even though remediation activities are ongoing more than 40 years after the site closed, groundwater at the site is still considered unfit for human consumption, and shore birds and other organisms are at risk. Part of the former mine site is located within the Goose Pond Estuary.

Within this context, the Maine legislature passed mining restrictions in the early 1990s that effectively prohibited metal mining. As a result, any mining activity in Maine was restricted to non-metallic mining (quarrying for rock, for example), at least until 2012.  While there still has been no active metallic mining since the 1990s, there sure has been a lot of activity.

In 2012, the Maine Department of Environmental Protection was directed by the Legislature to “modernize” the state’s 20 year old mining rules.  The new rules consisted of two parts: a section requiring permits for mineral exploration; and a section regarding the permitting process for mining-related activities.  The first part was adopted in 2013, but the second part was not approved by the legislature, hence creating an inconsistency between the existing mining rules and the Mining Act. The result has been a regulatory mess. In May of 2015, the Legislature’s Environment and Natural Resource Committee voted 8-5 to amend these rules again, but the resulting amendment failed to pass the Legislature.  By this time, both pro- and anti- mining positions were firmly entrenched.

Most recently, the Board of Environmental Protection voted unanimously to endorse a new set of regulations.   The proposed regulations attempt to resolve some of the shortcomings that had been pointed out last year. However, questions remain.

As an environmental and natural resource economist, my job is to look at the potential costs and benefits of any proposed legislation.  On the benefits side are the potential jobs and increased tax revenue that could come about from any development. On the costs side, of course, are the possible negative effects on the environment.

Let’s take a look at the benefits side of the equation. Anthony Hourihan, director of land development for Irving (a mining company with interests in Bald Mountain, one of the sites at the center of this debate), suggested that allowing this type of mining in Maine could result in 300 direct jobs and 400 indirect jobs, and a projection of $126 million in state and local taxes. Given that the proposed mining area lies in Aroostook county, an area of the state that experiences chronic persistent poverty and currently has an unemployment rate of 5 percent (as compared to 3.8% statewide and only 3.1% in Cumberland County), that is no small benefit.

But who will get these jobs?  Mining is not primarily a blue collar occupation any more -in fact, writes Phillipe Dolzone , a writer for the Balance, an online financial advice site, “The increasing complexity of the mining process and involved technology nowadays requires a much higher level of skills, including computer literacy.  As a result, most of the mining groups will more likely hire recently graduated students from high school programs in mining or technical school programs.”  Currently, Maine has none of these. So the first step in ensuring these jobs go to locals is to encourage any mining company that wants to establish a presence in Maine to incorporate a local training program, perhaps by partnering with a local Community college or trade school. One of the pitfalls of this “potential jobs” argument is just that- the jobs are potential. The job of a good economic development director is to ensure that those promised jobs do, in fact, materialize.

While a return to the days of mining camps is unlikely in Maine, companies may find it less costly to import talent from elsewhere rather than to foster it locally.  That may also be a boon to the area -if families come to Aroostook county for the mines and decide to stay, that itself is economic development.  It really depends on how long the mining activity is expected to last at a particular site. That,  in turn,  depends on the amount of reserves at the site and the rate of extraction, which in turn is determined by the price of the minerals and the cost of the technology needed to remove them.

That was the easy part. Now to look at the potential costs. Open pit mining,  which is the most common method and that most likely to be used in Maine, has the potential to expose radioactive elements,  as well as potentially contaminate groundwater and surface water. As minerals may be present in small quantities in a geographic area,  large quantities of ore need to be refined to get at it. Contaminants may be released into the water through separation of the minerals from the surrounding rock, where slurry containing mine tailings, water, and pulverized rock (which may in itself contain toxic or radioactive materials) is created. Other potential environmental costs are disruption to ecosystems and endangered species habitat,  large scale water extraction, and erosion.   Finally, some environmental groups have expressed concern that mining activity could affect Maine’s tourism industry.

To minimize these costs (and to maximize net benefit), the tailings or residue from mining activity must be contained and disposed of in a way that doesn’t adversely affect sediments, groundwater or surface water. Much of the waste that is generated is likely to be toxic or radioactive, and so proper disposal is essential.

Likewise, in order to minimize the harm done,  proper siting techniques need to be used. The mine’s footprint, including any access roads, must be sited in such a way that they don’t impact sensitive areas or endangered species habitat, or have the potential to increase flooding,  deforestation,  or erosion.

The biggest issues in the current fight over mining rules in Maine seem to be about both where mining can and can’t occur,  and what safeguards (environmental and financial) are in place to ensure restoration of the site after mining activities cease, as well as to pay for clean up should a disaster occur.

There are potential benefits and costs to mining in Maine.  The job of good policy is to ensure that institutions are in place to maximize the benefits and minimize the costs – as well as to ensure an equitable distribution of costs and benefits.  These include policies on local hiring, training and education, proper siting, and financial safeguards. Only then should each proposal be evaluated on its own merits.

I personally would like to see more economic development in Aroostook County. But only if that development does not come at excessive cost to the environment and to other industry.

What are your thoughts? Post them here!

The Social Cost of Carbon: Implications for Maine (Part II)

The Social Cost of Carbon: Implications for Maine (Part II)

My most recent blog post, “The Social Cost of Carbon: Implications for Maine (Part I),” went into some of the details behind calculating the social cost of carbon – a number that is used to illustrate the economic damages anticipated by climate change and therefore linked to carbon dioxide emissions.
This blog post will be a bit more policy oriented.  Once we arrive at a social cost of carbon, what do we do with it?  How can we use it to reduce the amount of carbon that’s emitted into the atmosphere?

Essentially, there are three policy options to reduce climate change.  One is what economists like to call “command and control.”  This is standard regulation – where each company or industry is given a standard beyond which they are not allowed to pollute.  If they are found to have polluted beyond that standard, they are then (typically) fined a certain amount.

The second and third option are what economists call “incentive-based regulation.”  Rather than give companies or industries a hard and fast limit, this type of regulation gives the regulated community an incentive to reduce emissions.  The incentive could be in the form of a subsidy for each unit of pollution reduced, or, alternatively, a tax system could be put in place.  In that case, the firm’s incentive to reduce pollution is the avoided tax on each unit. (From an economic perspective, there is actually no difference between a tax and a subsidy when it comes to determining the “efficient level” of pollution.  From a political perspective, of course, there is a huge difference.)

A third option is to implement a trading scheme.  The idea is simple: firms are distributed a certain number of permits or “rights” to pollute. (The permits could be initially distributed free of charge, or the permits could be auctioned off.)  Firms that could then reduce a unit of pollution more cheaply than the permit price would do so, and sell the unused permit on the market to other firms that have a more difficult time reducing pollution.  The firm’s incentive to reduce is the price that they get from selling their permit.  Creating a market like this is not without its difficulties, and markets for pollution have met with varying degrees of success.  One pollution market close to home is RGGI, the Regional Greenhouse Gas Initiative, which is the topic of one of my earlier blog posts.  The revenue gained from auctioning off the permits goes to energy-saving initiatives.

One of the major difficulties in both of these is to set the “right” price – too low, and not enough firms will reduce their emissions; too high, and it can create political dissatisfaction and a drag on the economy.  (A side note: unbridled carbon emissions are already creating havoc with Maine’s economy – but that will be the topic of a later blog post.)

A second major difficulty (what I like to call the “liberal’s paradox) is that implementing a carbon price will necessarily be regressive – the burden of the tax will be felt disproportionately among lower-income households.  A price on carbon – whether it’s a tax or a permit system – will raise the price of carbon-intensive goods and services, such as fossil fuels and conventionally-generated electricity.  Low-income households spend a higher percentage of their income on fuel and electricity than do higher-income households.  What to do? It turns out that what you do with the revenue from the tax (“revenue recycling”) can moderate or even negate the regressivity of the tax.

The think tank Resources for the Future (RFF) has published a series of articles addressing this very topic.  I’m going to address three possibilities for revenue recycling.  Two of them have to do with reducing taxes on other things – shifting the burden from taxing economic “goods” (like income and labor) to taxing economic “bads” (like pollution).  (After all, if part of the point of a tax is to alter behavior, why tax good things like income and employment?)  The third has to do with returning the revenue directly to the people.  So I’m going to focus on three alternatives: tax carbon, but lower the tax on labor income; tax carbon, but lower the tax on capital income; and tax carbon, but return the revenue to the people in the form of a dividend or a lump-sum rebate.

RFF analyzed these three alternatives for their impact on different income groups to see which groups were “better off” after the tax and revenue-recycling scheme, and which were “worse off.”  (It’s important to note that RFF did not analyze the effects of reducing carbon emissions – the primary goal of the tax, after all! – on the welfare of each of these groups.  It’s well-known that low-income populations are the most sensitive to climate change, and therefore the group most likely to benefit from a reduction in greenhouse gas emissions.)

What they find, summarized, is this: the labor tax recycling scenario found that almost all groups ended up slightly worse off (the groups’ welfare or well-being declined by less than a half of a percent), but that the highest income group ended up with the biggest decline in welfare.  The capital tax recycling scheme benefited the highest income group, while generating a reduction in welfare for all other income groups of less than one percent.  And the lump sum rebate scheme benefited the lowest income group by more than three percent, while harming the highest income group by almost two percent.  From an efficiency perspective, the capital tax recycling scheme is the most efficient (that is, the policy that “distorts” the economy the least).

I’ll replicate RFF’s graphic here:

Source: 2015. Williams, Roberton C., Burtraw, Dallas, and Morgenstern, Richard. “The Impacts of a US Carbon Tax across Income Groups and States.” Washington, DC: Resources for the Future).

Why such differences?  Largely, it has to do with where individuals earn their income.  Generally speaking, high-income households get a larger percentage of their income from capital (stocks, bonds, and property), while middle-income people rely more heavily on income from labor.  Low-income people typically get a larger percentage of their income from transfer payments, which not only include food stamps and unemployment insurance but also Social Security.  That explains why lowering the tax on capital would exacerbate the regressiveness of the carbon tax, while lowering the tax on labor would be slightly progressive.

What about here in Maine?  I wasn’t able to get data directly for Maine, but only for New England as a whole.  As it turns out, all the schemes end up diminishing the welfare of New England residents, but the lump-sum rebate actually performs the worst.  Why?  The answer mainly has to do with the fact that, overall, New Englanders receive a relatively high percentage of their income from capital as opposed to labor.

How about Maine, though?  Is that the case? Looking at the Bureau of Economic Analysis for 2015, I noticed that Mainers as a whole received about 60% of their personal income from wages and salaries.  An additional 22.5% comes from personal transfer receipts, which include Social Security benefits, medical benefits, veterans’ benefits, and unemployment insurance benefits.  (By far the majority of these personal transfer receipts are retirement income and income from other benefits, excluding unemployment insurance benefits and income maintenance programs such as general assistance.)  A little less than 18% comes from capital and property income.

By contrast, Connecticut receives about 66% of its personal income from wages and salaries, 12.8% from transfer payments, and over 21% from capital and property. This implies that lowering the tax on capital would not benefit the average Mainer as much as the average person from Connecticut – but without doing the calculations, I can’t be sure whether the labor tax recycling scheme or the lump sum dividend would be more or less welfare changing.

Of course, the election on November 8 may have made this a moot point.  Passing a carbon tax (or fee, as some like to call it) has had a difficult time in the past, and the election of Donald Trump has made that possibility more remote.  Any action now is likely to arise at the state level – which is why state level analysis is crucial.  Climate change will likely have a disproportionate effect on those who are least able to protect themselves.  Any actions to mitigate climate change should not increase the injury.

The Social Cost of Carbon: Implications for Maine (Part I)

The Social Cost of Carbon: Implications for Maine (Part I)

wpid-depositphotos_8147881_xs.jpg

(This will be the first in a series of blog posts on carbon emissions, their costs and implications for Maine, and existing and proposed policy prescriptions.)

Last week, an article made the rounds entitled “the social cost of carbon“. This is of special interest to me right now, because I recently began teaching Environmental Economics at the University of Southern Maine. (Being a professor used to be my full-time job. Now I’m an economic and sustainability consultant, but teaching that class one day a week keeps me up to date on the most recent articles in my field.)

The concept of “social cost” in economics is nothing new, of course.  Economists have long recognized that the production and consumption of certain goods produces negative externalities, or costs imposed on “third parties” who are not directly involved in producing or purchasing that good.  Such externalities can be called social costs, and while it’s difficult to measure such social costs, environmental economists do their best (see, for example, my recent blog post on ecosystem services).

So why this new article on the social cost of carbon, and why is it taking on a new importance now? Because the social cost of carbon has now been upheld by a federal appeals court.

The details of the case are not particularly important for our purposes here. Suffice it to say that, every time a federal agency imposes a regulation, they are required to demonstrate that the benefits of the regulation exceeds the costs.  This particular case was about improving the efficiency of commercial refrigeration equipment.  But if the government (in this case, the Department of Energy) wants to tighten efficiency standards, they need to show that the costs of meeting the new efficiency standards aren’t exceeded by the benefits.

The costs of meeting the proposed standards are relatively easy to calculate. Refrigeration equipment companies might have to use new technologies or inputs, which are presumably more expensive than current methods. But how to calculate the benefits of tighter energy standards?  Enter the social cost of carbon.

The social cost of carbon is, according to the EPA, “meant to be a comprehensive estimate of climate change damages and includes, among other things, changes in net agricultural productivity, human health, property damages from increased flood risk and changes in energy system costs.” Yet the EPA admits that the social cost of carbon does not include all damages, because “of a lack of precise information on the nature of damages and because the science incorporated into these models naturally lags behind the most recent research.”

The economic and scientific calculations that went into arriving at  the social cost of carbon are mindboggling. The estimates used three well-known (well, well-known in certain circles) integrated assessment models that consider the linkages between climate processes and economic growth. These models translate emissions into atmospheric greenhouse concentrations, from there into changes in temperature, and finally from there into economic damages.

It is an ambitious undertaking, and some would say an impossible one. There are so many uncertainties in any step along that chain. For example, the models are ill-equipped to deal with non-linearities or “tipping points.”.  In addition, the damages from an additional unit of CO2 is unlikely to have a linear effect (as a price per ton of carbon would imply), but increase as more carbon is emitted into the atmosphere. Dealing with future costs is difficult as well, as it involves “discounting the future,” a sticky ethical and legal problem as well as an economic one.

I am of the school of thought that “some number is better than no number.” Yes, the social cost of carbon as it stands now is highly imperfect and probably a gross under-estimate of the full social damages caused by a ton of carbon dioxide in the atmosphere.  However, it is better than assigning a cost of zero, which would be the implicit price had the social cost of carbon not been considered.

This blog is supposed to focus on the links between the economy and the environment in Maine. So far this blog post hasn’t done that – but be  patient!. The next blog post will focus on some of the possible solutions in terms of mitigation of climate change via a tax or a trading scheme (specifically for Maine), and the last will sketch out what’s at stake for the state. Stay tuned!