Author: Rachel Bouvier

PFAS Chemicals: Why Prevention is the Best Medicine

PFAS Chemicals: Why Prevention is the Best Medicine

What are PFAS chemicals? Although the name is obscure, their effect is widespread and overreaching. PFAS are a group of approximately 9000 hazardous chemicals used in both industrial processes and consumer goods. PFAS chemicals were created in the 1930s and subsequently used in America’s commercial and industrial sectors, even contributing to the success of the Manhattan Project. After the efficiency of the chemicals became widely known, their usage increased dramatically. But because of the ubiquitousness and persistence of the chemicals, they ended up in our wastestream, with widespread consequences. 
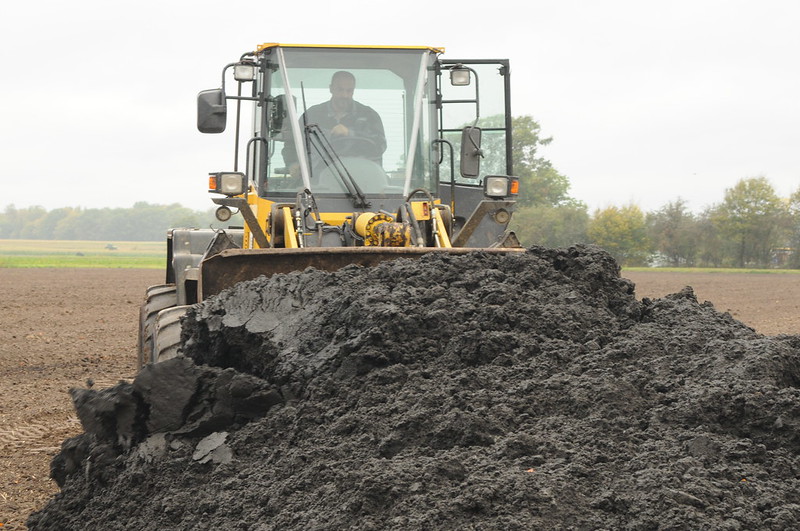
For both environmental and economic reasons, waste treatment facilities have historically sold sludge to farmers to be used as fertilizer. This saved money for farmers and municipal waste facility operators as it seemed to be a practical disposal method. In short, this process was a prime example of the circular economy at work, and many environmentalists (including some of us at rbouvier consulting) lauded the practice. Unfortunately, PFAS chemicals (also known as “forever chemicals”) have since been demonstrated to be hazardous for the environment, capable of rapidly spreading, and extremely durable. PFAS chemicals spread through groundwater aquifers, air, building improvements, surface soils, deep soils, and water. In humans, exposure to PFAS chemicals has been linked to thyroid disease, testicular and kidney cancer, pregnancy-induced hypertension, ulcerative colitis, and increased cholesterol. Lastly, PFAS chemicals harm the environment and have a negative effect on wildlife. 

In other words, the well-intentioned use of the sludge as fertilizer ended up harming the very farmers it was intended to help. In Maine, that has led to financial disaster for many dairy farms and disruption to the local food system. Moreover, rather than being able to be used as fertilizer, the sludge has had to be diverted to landfills, where the liquid sludge may cause an imbalance and increase the risk of collapse. 

How did this happen? And what can we do to ensure this doesn’t happen again?
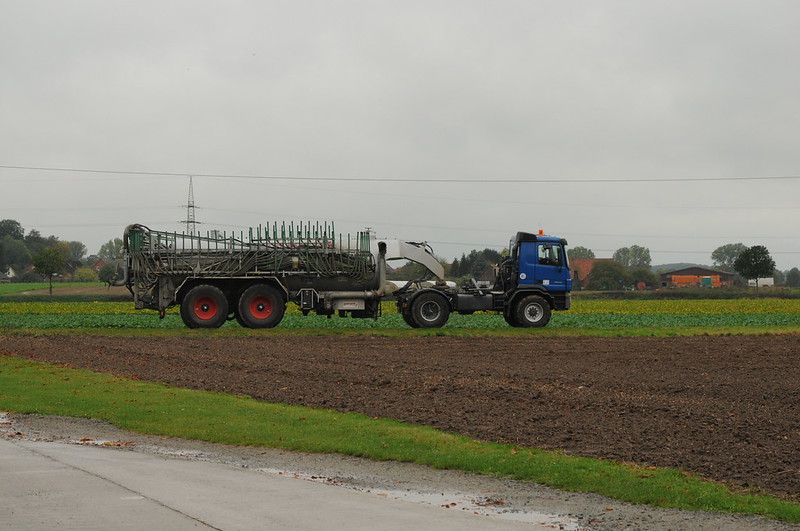
Vehicle for application of liquid sludge” by Sustainable sanitation is licensed under CC BY 2.0.

Prior to 2016, many chemicals were regulated under the Toxic Substances Control Act (TSCA), which gave the EPA authority to require reporting and restrictions for various chemicals. Unfortunately, it was widely acknowledged to be ineffective. In 2016, Congress overwhelmingly passed a bill updating TSCA that would test unregulated chemicals currently on the market to ensure they meet environmental standards. Among these chemicals is, of course, PFAS, which have already been shown to be toxic for the environment. 

While a good start, it will still take decades for the EPA to test and approve of chemicals already present in the marketplace, let alone new ones, which are being introduced all the time. In the meantime, cleaning up PFAS chemicals will be expensive. Inaction, though, would also be costly, although those costs (primarily health and productivity) are not always as overt. The Investment and Jobs Act, which passed with bipartisan support, allocated roughly $2 billion dollars to help remedy the effects of PFAS chemicals on drinking water. 

Complicating things further, state level approaches to PFAS chemicals vary widely, as reported in a recent article in the Portland Press Herald. California, a state known for its commitment to environmentalism, has taken no action to stop the spread of PFAS contaminated sludge onto farmland. This is a position polar opposite to Maine, which sparks several questions. Does California know something Maine doesn’t? Are there additional environmental and economic factors at play? Meanwhile, the EPA has yet to announce a formal position on how to address PFAS chemicals, a result which many states are waiting on before taking action. Ultimately, the strong contrast in responses between California and Maine – two traditionally environmentalist states – shows that the issue of PFAS chemicals is far from settled.

The concern about PFAS chemicals is a prime example of actions that seem to save money in the short run, but are actually costly in the long run. Economists call these actions “false economies.” This is our mission at rbouvier consulting, to address environmental issues from an economic perspective. If you are interested in this issue, the referenced sources below provide more detail, or contact us directly. 

Post by Connor Feeney

Works Cited

Tachovsky, M., & Bell, R. (2021, May 11). Real estate damage economics: The impact of 

PFAS “forever chemicals” on Real Estate Valuation. Taylor & Francis. Retrieved March 21, 2023, from https://www.tandfonline.com/doi/full/10.1080/10406026.2021.1923926 

Cordner, A., Goldenman, G., Birnbaum, L. S., Brown, P., Miller, M. F., Mueller, R., Patton, 

S., Salvatore, D. H., & Trasande, L. (n.d.). The true cost of PFAS and the benefits of acting now. Environmental Science & Technology. Retrieved March 8, 2023, from https://pubs.acs.org/doi/10.1021/acs.est.1c03565 

Environmental Protection Agency. (n.d.). EPA. Retrieved March 21, 2023, from 

https://www.epa.gov/pfas/key-epa-actions-address-pfas

Overton, P. (2023, March 19). From Maine to California, the solution to sludge disposal is not settled. Press Herald. Retrieved March 21, 2023, from https://www.pressherald.com/2023/03/19/from-maine-to-california-states-struggle-with-sludge-solutions/
Rachel’s Journal Roundup Q3 2022

Rachel’s Journal Roundup Q3 2022

  1. Theine,H.; Humer, S.; Moser, M.; Schnetzer, M. 2022. “Emissions inequality: Disparities in income, expenditure, and the carbon footprint in Austria,” Ecological Economics (197).

Recently, we completed a project for the Blue Hill Heritage Trust, where we estimated the economic, social, and environmental carrying capacity of the peninsula. One of the issues we considered was the environmental impact of those moving to the area. Like many areas in Maine, the Blue Hill region is seeing an influx of wealthier individuals to the area, primarily due to the rise of remote work. One question that was brought up for us is how households’ environmental impact changed with higher income levels. This article investigates the carbon content of households’ expenditure patterns. They find that the top decile of the income distribution in Austria receives 22% of national income, spends 18% of national expenditure, and causes 17% of emissions. The bottom decile, by contrast, accounts for just 3% of national income, 4% of expenditure, and 4% of emissions. While the article focuses on Austria, results are suggestive for the United States, where income inequality is much larger than it is in Austria. 

While differences in income may explain some of the differences in emissions, they only explain about one third of the difference, implying that the remaining two-thirds of the variation in emissions is attributed to other factors. Not surprisingly, results show that characteristics such as housing stock, heating fuel, and car dependence all contribute to the variation in household carbon emissions. 

These results are not surprising. However, they do bring up a question about the environmental footprint of households moving to Maine (and other places). If, as evidence seems to indicate, higher income people are moving to Maine, it may presage an increase in carbon emissions, based upon these results.  However, the potential good news is that two-thirds of the variation in emissions was due to other factors. If newcomers to Maine reduce their dependence on fossil fuels either by weatherizing or upgrading existing housing stock, they may be able to mitigate some of the increase in emissions coming from increased consumption. If public transportation can be improved in areas that are attracting in-migrants, so much the better. It is possible that an influx of in-migrants will increase carbon emissions. But it is not inevitable.

  1. Kovacs, K.; West, G.; Nowak, D.; Haight, R. 2022. “Tree cover and property values in the United States: A national meta-analysis.,” Ecological Economics (197).
Tree canopy” by Jim Stanton is licensed under CC BY 2.0.

This article explores the relationship between tree coverage and property values. The authors refer to tree coverage as a public good because increased tree coverage in a given area of a neighborhood has been shown to increase value of the homes throughout the entire neighborhood. A representation of this relationship would help municipalities quantify the benefits of community forestry programs. 

The hedonic property value method is a statistical technique that can be used to assess the value of ecosystem services to property. However, these studies are expensive and time-consuming, and oftentimes, local governments are unable to access the resources needed to carry out these analyses. The authors used hedonic property studies conducted in the past to create a benefit transfer tool (whereby multiple hedonic analyses are combined in a meta-analysis) that can be used to measure the value of tree coverage in communities that have not yet conducted hedonic property value analyses. 

Results indicate that where existing tree cover is low, increasing on-property tree density increases property values, while increases in off-property tree cover has no statistically significant effect. In contrast, where tree cover is medium to high,, off -property tree cover has a greater positive effect on property valves than on-property tree cover. This perhaps reflects the belief that high density tree cover on the property is seen as increasing maintenance costs. 

Although the study finds relatively low property value effects, increases in property values are only a small part of the benefits of increased tree cover. The ecosystem services provided by tree cover include air filtration, soil stabilization, flood control, recreation, and habitat provision, as well as aesthetic value. The authors conclude by noting that hedonic property studies can also be used to support open space zoning and green space ordinances.

  1. Mueller, J. 2022. “Natural Resource Dependence and Rural American Economic Prosperity From 2000 to 2015,” Economic Development Quarterly 36(3):160–176. 

This article investigates the role that natural resources play in the economic development of US counties. There are two types of natural resource development: extractive natural resource use, such as oil and gas, mining, and timber, and non-extractive, such as tourism, recreation, and real estate. The author points out that dependence on natural resource development has been shown to be associated with decreases in per capita income, increases in inequality, and elevated poverty in the long term (the so-called “resource curse”). Yet not as much attention has been paid in the literature to the dependence on non-extractive natural resource development. This study aims to correct that, by studying both forms of resource development on economic outcomes in rural counties across the United States. The author makes a distinction between remote rural counties and metro-adjacent rural counties. 

The author finds that the relationship between natural resource development and economic prosperity varies between non-metropolitan remote and nonmetropolitan metro-adjacent counties. Generally speaking, high levels of dependence on either extractive or non-extractive resource development was associated with negative economic outcomes for both remote and metro-adjacent rural counties. However, these relationships were complex. Non-extractive resource development in particular has been promoted in some strands of the literature to have a positive effect on economic outcomes in rural areas. But this work casts doubt on that hypothesis, indicating that non-extractive resource development may actually have a negative effect on the economic outcomes of remote rural counties, perhaps due to the low wages in many of those industries. More work needs to be done in this area.

Assessing the Carrying Capacity of the Blue Hill Peninsula

Assessing the Carrying Capacity of the Blue Hill Peninsula

What trends in Maine (unceded Wabanaki Territory) are threatening conservation of the farmland, forests, wetlands, and wildlife habitat that is needed to sustain ecological and community health in a changing climate?

As our communities attract more and (perhaps more urban and wealthier) households, how will the influx affect the capacity of our communities to sustain itself?

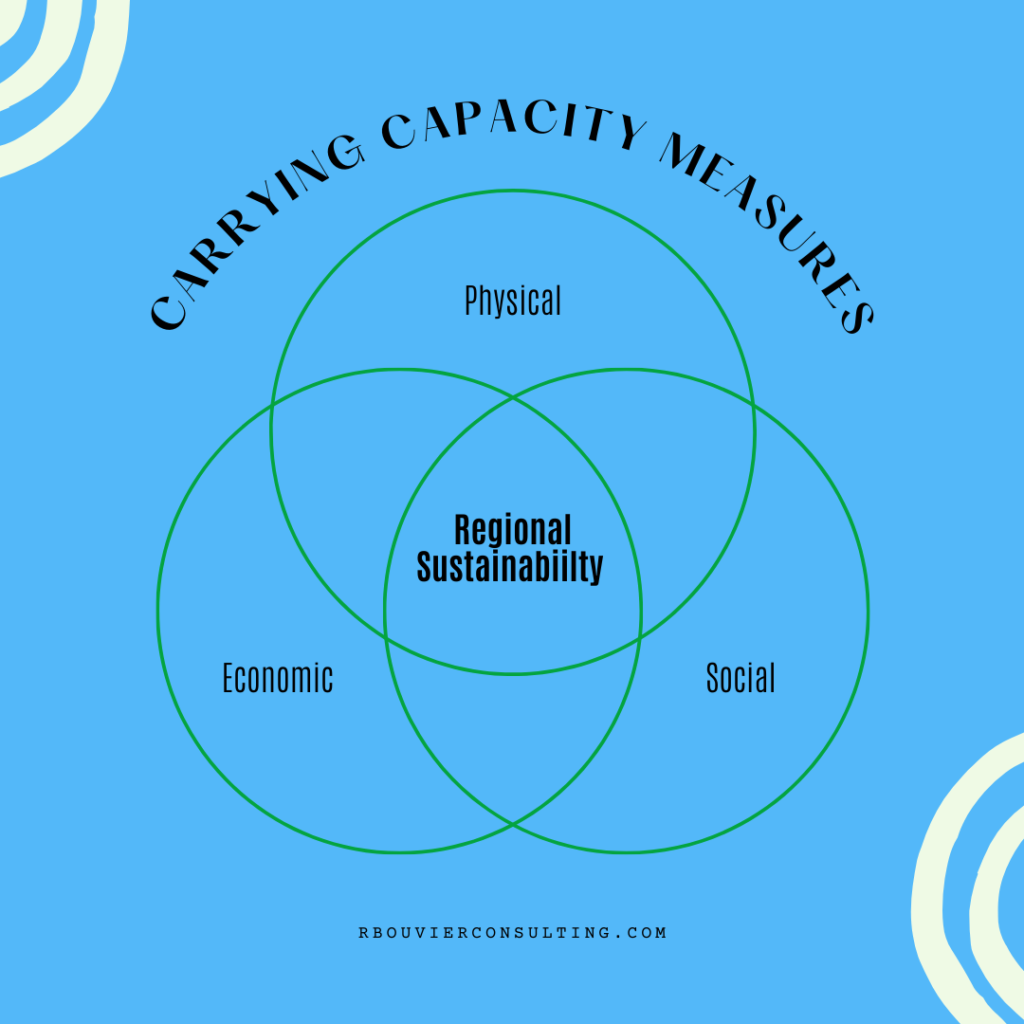
regional carrying capacity measures are social, economic and physical

The team at rbouvier consulting recently completed a study: “Assessing the Carrying Capacity of the Blue Hill Peninsula,” looking at just that. The project was done at the request of Blue Hill Heritage Trust (BHHT), a conservation organization that is shifting the meaning of conservation from recreation and scenic preservation to working lands and community use. BHHT uses outreach and education to increase the chances of fulfilling their mission: “to lead in conserving land, water, and wildlife habitat on the greater Blue Hill Peninsula; to teach and practice a stewardship ethic; to promote ecological, economic, and community health for this and future generations” (BHHT, 2022). The study looks at the current trends of climate and covid migration impacting the communities of the Blue Hill, Brooklin, Brooksville, Castine, Deer Isle-Stonington, Penobscot, Sedgwick, and Surry. 

Want to know what we found?

For this research, rbouvier consulting looked at two specific trends: 1) pandemic-related population trends and climate-related migration trends, trends that have the potential to impact the entire state.) Our charge was specifically to to the following:

  1. Assess the extent of COVID-19-related migration on the peninsula and its impacts.
  2. Investigate if climate migration is happening on the peninsula and what the future impacts may be.  
  3. Assess the carrying capacity of the Blue Hill Peninsula and the region’s ability to absorb an inflow of migration.

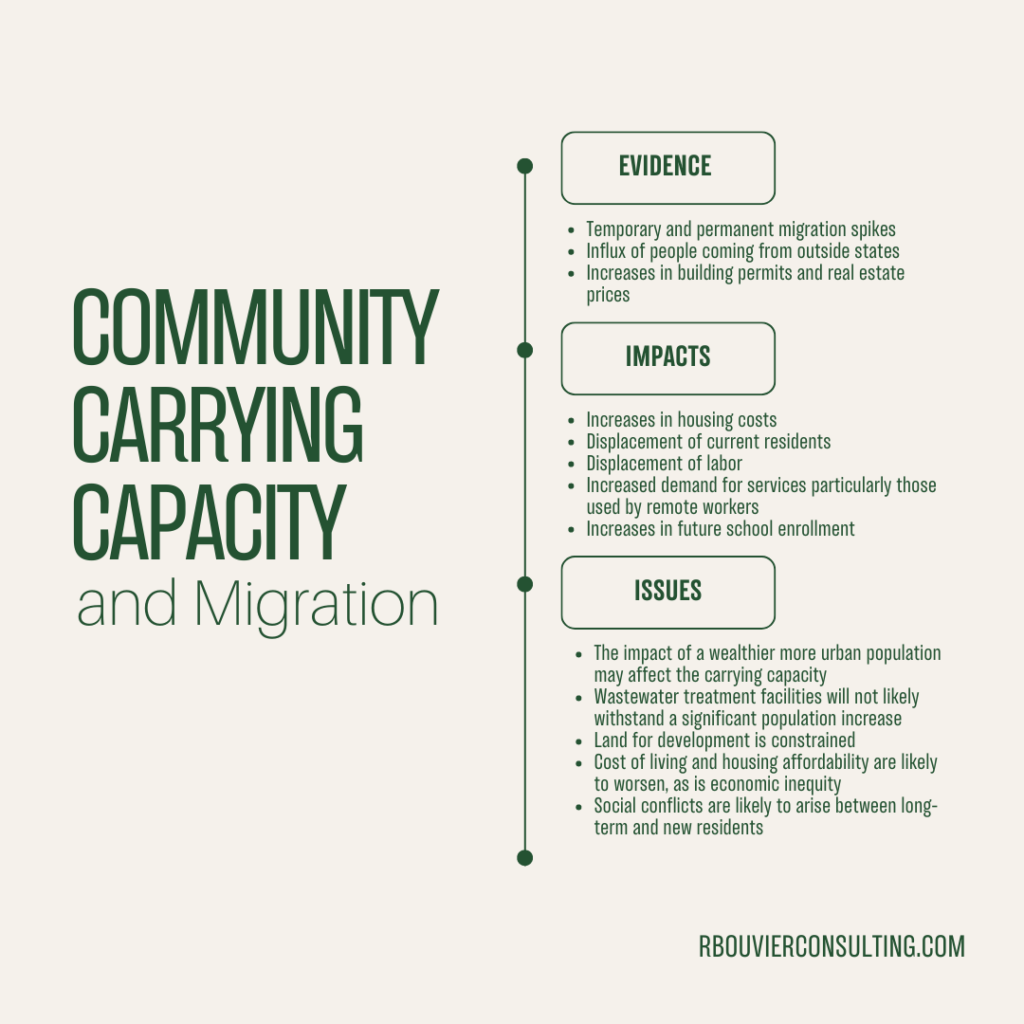
To assess how the COVID-19 pandemic impacted domestic migration patterns on the peninsula, researchers used change-of-address (COA) request data to quantify estimated change in population due to Covid-19. They identified the origins of movers to the project area, from 2018 to 2021 and determined the origins of migrating households. The findings show a clear overall increase in total COA requests (both permanent and temporary)  to the peninsula presumably due to COVID-19 (22%), with variable rates in each community, changing the trend from negative net population to positive. The group also looked at both school enrollment data and housing prices to learn more about the impacts on migration locally. Findings include:

  • Both temporary and permanent migration spiked in March 2020. Compared to March 2019, permanent COA requests were up over 53%, while temporary COA requests were up by almost 264%.
  • However, in 2021, those trends seem to have reversed, and net COA requests were once again negative, indicating that the population influx may not have been permanent.
  • Incoming COVID-19-related migration patterns reveal people moving to the peninsula were predominantly from outside of New England and from urban areas.
  • The number of building permits increased slightly, as did home sales and real estate prices.

To assess the impact of climate migration on the Blue Hill Peninsula our researchers were concerned with assessing a) if climate migration is occurring, and, if so, b) who is migrating and from where. To investigate these questions, we completed a literature review of climate migration studies, and inquired into national taxation data published by the IRS to compare filings before and after the pandemic. As part of our investigation, we compared migration trends with weather information for specific climate events and gleaned demographic information about climate migrants to the Blue Hill Peninsula. Further assessment was done to estimate the impact of this trend on housing, jobs, infrastructure and schools.

  • Households driving current climate migration trends have the financial wherewithal to move by choice to escape from perceived dangers (wildfires, flooding, hurricanes, or a pandemic).
  • The households that migrated to Hancock County in 2020 had an average income that was 20% above the average household income for the county in 2019.  

For this study, rbouvier consulting defined carrying capacity in terms of regional sustainability. Looking at regional analysis and tourism impact studies, we determined three interconnected component systems that simplify regional systems: a) physical, b) economic and c) social. With these three focus areas, we developed candidate indicators and screened those indicators for data availability and accessibility. Initial data collection focused on establishing a threshold level for each. With these indicators and baselines set, we evaluated each indicator against the threshold and were able to categorize each indicator with a rating scale based on levels of constraint on the system.  When we combine migration findings with carrying capacity analysis, the findings reveal present and future constraints on the carrying capacity of the region as follows:   

  • The impact of a wealthier, more urban population may affect the carrying capacity of the peninsula. 
  • The wastewater treatment facility in Blue Hill is not likely to be able to withstand a significant increase in population. Moreover, the facility is at risk from sea level rise. 
  • Roads and schools are likely to remain unconstrained for the foreseeable future.
  • Land for development is already constrained, though it varies in each community.
  •  There appears to be enough land for farming, but to the extent it is being farmed is unknown. Preservation of farmland is already below  conservation targets. 
  • Both cost of living and housing affordability are likely to worsen, as is the economic inequality in the region. 
  • Social conflicts are likely to accelerate between long-term residents and new arrivals.

 Why is this work important?

We feel that this is exactly the kind of research that communities should have at their disposal while they are working on planning the future in uncertain times. The pandemic might have spurred  a spike in migration, but  climate migration seems to be an progressive trend, bumping up migration with each significant climate event. That is why we have begun to study the migration trends for Cumberland County. We expect to release our findings to the public soon. So, stay tuned for that. In the meantime, we have permission to share the study if asked. If you would like to read Assessing the Carrying Capacity of the Blue Hill Peninsula, please drop us a line.

Economics of Climate Change

Economics of Climate Change

Lake Chilwa, Malawi” by U.S. Geological Survey is marked with CC0 1.0.

During the summer of 2022, I created and taught a course entitled “The Economics of Climate Change.” In honor of the 2022 United Nations Climate Change Conference in Sharm El Sheikh, Egypt, I thought I would share the outline of the course and reading materials. 

We began by a brief overview of the physical causes and consequences of climate change, followed by discussion of several guiding questions:

  • How can economics help us to think about and analyze the causes of climate change?
  • How can economics help us to think about and analyze the consequences of climate change?
  • How can economics help us to think about and analyze the costs of climate change mitigation?
  • How can economic policies help us to reduce climate change? and
  • What are the equity considerations surrounding climate change? 

Our primary readings were a teaching module published by the Global Development and Environment Institute at Tufts University, and the latest version of the IPCC (International Panel on Climate Change) report. The citations and links are below. 

  1. Harris, J., Roach, B., and A-M Codur. 2017. The Economics of Global Climate Change. Medford, MA: Global Development and Environment Institute. https://www.bu.edu/eci/files/2019/06/The_Economics_of_Global_Climate_Change.pdf 
  1. IPCC, 2022. Summary for Policymakers. In: Climate Change 2022: Impacts, Adaptation and Vulnerability. Contribution of Working Group II to the Sixth Assessment Report of the Intergovernmental Panel on Climate Change  Cambridge University Press, Cambridge, UK and New York, NY. https://www.ipcc.ch/report/ar6/wg2/downloads/report/IPCC_AR6_WGII_SummaryForPolicymakers.pdf

We also relied heavily on readings from the Economist magazine.  I have included the links below, but they are behind a paywall. Please check to see if your local library subscribes to this publication. 

Readings from The Economist Magazine:

  1. Staff, 2019. “The past, present, and future of climate change,” The Economist. September 21 [updated Jan 17 2020]. London. https://www.economist.com/briefing/2019/09/21/the-past-present-and-future-of-climate-change 
  2. Staff, 2020. “Why tackling global warming is a challenge without precedent,” The Economist. April 23 [updated May 23 2022]. London. https://www.economist.com/schools-brief/2020/04/23/why-tackling-global-warming-is-a-challenge-without-precedent 
  3. Staff, 2020. “Damage from climate change will be widespread and sometimes surprising,” The Economist. May 16 [updated May 23 2022]. London. https://www.economist.com/schools-brief/2020/05/16/damage-from-climate-change-will-be-widespread-and-sometimes-surprising 
  4. Staff, 2020. “How modelling articulates the science of climate change,” The Economist. May 2 [updated May 23 2022]. London. https://www.economist.com/schools-brief/2020/05/02/how-modelling-articulates-the-science-of-climate-change 
  5. Staff, 2020. “The world urgently needs a price on carbon,” The Economist. May 23. London. https://www.economist.com/briefing/2020/05/23/the-world-urgently-needs-to-expand-its-use-of-carbon-prices 
  6. Shumpeter, 2021. “What if firms were forced to pay for frying the planet?” The Economist. October 9. London. https://www.economist.com/business/2021/10/09/what-if-firms-were-forced-to-pay-for-frying-the-planet 
  7. Staff, 2020. “Climate adaptation policies are needed more than ever,” The Economist. May 30. London. https://www.economist.com/schools-brief/2020/05/30/climate-adaptation-policies-are-needed-more-than-ever 
  8. Staff, 2017. “Climate change and inequality,” The Economist. July 13. London. https://www.economist.com/finance-and-economics/2017/07/13/climate-change-and-inequality 
  9. Staff, 2022. “Do men and women think about climate change differently?” The Economist. July 22. London. https://www.economist.com/graphic-detail/2022/07/22/do-men-and-women-think-about-climate-change-differently 
  10. Staff, 2021. “Maine relies on its marine life, but climate change will alter what that means,” The Economist. October 23. London. https://www.economist.com/united-states/2021/10/23/maine-relies-on-its-marine-life-but-climate-change-will-alter-what-that-means 

Other readings came from McKinsey and Company, Resources for the Future, the Brookings Institute, and others:

  1. McKinsey and Company, 2007. “Reducing US greenhouse gas emissions: How much at what cost?” Executive Summary. https://www.mckinsey.com/capabilities/sustainability/our-insights/reducing-us-greenhouse-gas-emissions.
  2. Hafstead, M., 2019. “Carbon Pricing 101,” Resources for the Future, Washington DC. https://www.rff.org/publications/explainers/carbon-pricing-101/.
  3. Hayes, K. and M. Hafstead, 2020. “Carbon Pricing 103: Effects across sectors,” https://www.rff.org/publications/explainers/carbon-pricing-103-effects-across-sectors/
  4. The Hamilton Project and the Stanford Institute for Economic Policy Research, 2019. Ten Facts about the Economics of Climate Change and Climate Policy. Washington, DC: Brookings Institute. https://www.brookings.edu/wp-content/uploads/2019/10/Environmental-Facts_WEB.pdf
  5. Urpelainen, J. and George, E. 2021. “Reforming Global Fossil Fuel Subsidies”, Washington, DC: Brookings Institution. https://www.brookings.edu/research/reforming-global-fossil-fuel-subsidies-how-the-united-states-can-restart-international-cooperation/
  6. Hu, Ellie. 2022. “The Gendered Impacts of Climate Change” [blog post]. Global Development Policy Center: Economics in Context Initiative. Boston, MA. https://www.bu.edu/eci/2022/05/17/the-gendered-impacts-of-climate-change/ 

We also listened to an eight part podcast entitled “To a Lesser Degree,” also from the Economist. The series was a runup to the COP 26 Conference in Glasgow, Scotland. You can find the entire series here: https://www.economist.com/podcasts/2021/09/25/to-a-lesser-degree-a-climate-podcast-from-the-economist. No subscription required. 

Finally, we listened to two episodes of the podcast “Resources Radio,” from the Washington, DC-based think tank Resources for the Future: 

  1. Raimi, Daniel [host]. 2020. “Which Climate Change Path are We On?” [Audio Podcast Episode]. In Resources Radio, Resources for the Future. Feb 25. https://www.resources.org/resources-radio/which-climate-path-are-we-zeke-hausfather/ 
  2. Hayes, Kristin [host]. 2019. “Carbon Dioxide Removal,” [Audio Podcast Episode]. In Resources Radio, Resources for the Future. April 2. https://www.resources.org/resources-radio/resources-radio-carbon-dioxide-removal-greg-nemet-university-wisconsin-madison/ 

Feel free to email me for more information!

Second Quarter 2022 Journal Round Up!

Second Quarter 2022 Journal Round Up!

  1. Hynes, et al. 2022. “Estimating the costs and benefits of protecting a coastal amenity from climate change-related hazards: Nature based solutions via oyster reef restoration versus grey infrastructure.” Ecological Economics, vol 194.
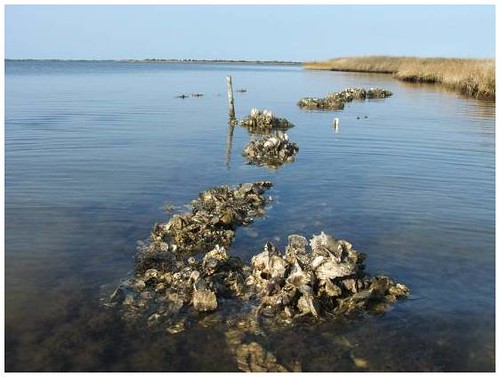
Oyster reefs” by USFWS Headquarters is licensed under CC BY 2.0.

While ecologists have known that nature-based solutions to problems like flooding and pollution control are in many cases less expensive and more efficient than human-made solutions, economists have been rather late to the party. A case in point is discovering that so-called “green infrastructure,” like restored wetlands or oyster reefs, can be better in many ways than “gray infrastructure,” or manufactured barriers to wave action. 

This article investigates the recreational value associated with restoring an oyster reef bar that would act as a natural breakwater versus a permanent seawall on a coastal walking trail that is under threat from sea level rise and storm surge. The authors estimated the costs of protecting the walking trail under both scenarios, and found that the benefit-cost ratio of restoring the oyster reef was several times higher than the benefit-cost ratio of the manmade seawall. Moreover, the analysis does not include the positive ecosystem services that the oyster reef could provide above and beyond providing a natural breakwater, such as pollution control or carbon sequestration. 


2. Huang, Yui and Woodward, R. 2022. “Spillover Effects of Grocery Bag Legislation: Evidence of Bag Bans and Bag Fees.” Environmental and Resource Economics (81:711–741) 

This article investigates the unintended consequences of carryout grocery bag regulations by looking at the impact on sales of alternative plastic bags. The unfortunate conclusion of the article is that both the carry out bag ban and the carry out bag fee that they examined led to a significant increase in small plastic trash bag consumption. Whereas previous studies had looked at whether fees on single use plastic bags in grocery stores directly reduced the usage of those bags or increased recycled bag usage, this is one of the first studies to look at the indirect effects of such policies. Their hypothesis is that consumers reuse plastic grocery bags as trash can liners. When those bags either became more expensive or less available, consumers switched to purchasing small trash bags. This article highlights the importance of considering unintended consequences of well-meaning regulations.

Changes to the Census: What it Means to Researchers and Policy Makers

Changes to the Census: What it Means to Researchers and Policy Makers

At rbouvier consulting, we understand how vital Census data is at all levels of society. Not only is decennial Census data used to appropriate seats in the US House of Representatives, state governments, and allocate billions of dollars in federal funding, it’s also vital data used in research across the country that supports both public and private decision making.  

Which is why we’re concerned about changes to the 2022 Census and what it might mean for researchers and policy makers alike.

Challenges of the 2020 Census  

The 2020 Decennial Census was set to face unprecedented challenges even before the COVID-19 pandemic hit. In 2019, Kenneth Prewitt, a Carnegie Professor of Public Affairs and the Special Advisor to the President at Columbia University, spoke out about the 2020 Census and the issues it was expected to face. He addressed the major challenges the decennial census has faced throughout history and the nuanced challenges of the 2020 decennial census.

Since its inception, the census has consistently faced two major challenges: operational issues and partisan interference. Budget constraints and public distrust in the period prior to the COVID-19 pandemic added to those difficulties for the 2020 census. 

The US Census Bureau’s advertising budget for the 2000 and 2010 Censuses was dramatically boosted as a result of the concerningly high and rising non-response rates in the 1990 Census. Due to the success of the Bureau’s advertising activities and the country’s population growth, another budget rise for the 2020 Census was anticipated. Congress, however, decided against approving a budget increase for the 2020 Census. The Census Bureau did manage to offset at least part of its budget constraints by allowing able households to fill out the Census online. It also used administrative records to fill in gaps when respondents choose not to answer certain questions, helping to avoid costly in-person follow-ups to these respondents’ homes. The use of administrative records, however, posed another operational issue to the Bureau: public distrust and privacy concerns, which were more difficult to manage. 

Unsurprisingly, the outset of the pandemic brought about additional operational issues as concerns over health and safety halted all in-person operations. When in-person field operations did resume, the country was experiencing multiple hurricanes and deadly wildfires, and the Census Bureau struggled to find in-field staff due to public health concerns. Additionally, the country saw a mass number of people that were forced to relocate due to both the pandemic and multiple natural disasters, impacting the public’s ability to participate in the Census and the Bureau’s ability to reach certain households. There were a number of actions the Bureau took to mitigate these challenges, such as encouraging online responses and extending in-field operations by two months.2 

Partisan interference is a long-standing tradition of the Census, and the 2020 Census was no exception. Interference in the 2020 Census came in the form of a directive from the Trump Administration to add a citizenship question to the 2020 Census form. The Administration claimed that the directive would assist the US Department of Justice in applying the Voting Rights Act. The directive went against the recommendation of the Census Bureau and sparked a fierce debate. The Bureau held that the question would both increase costs and result in a significant increase in non-response rates about immigrants and non-citizen households. It was expected that, if this question were to be added to the 2020 Census form, major cities with large immigrant populations could lose up to billions in federal funding. Many also feared the addition of a citizenship question would have significant implications for both disaster relief funding and disaster planning. Without an accurate count of the population, planners and emergency responders would struggle with both identifying vulnerable populations and effectively allocating resources. The Trump Administration did ultimately drop its efforts to add a citizenship question due to legal challenges, however, it is possible that the Administration’s efforts had lasting effects on the public’s view of the Census. The heated political debate both increased public concerns about the use of the Census as a government surveillance tool, as well as throwing the topic of the Census into a fiercely politically polarized debate. 

Quality of the 2020 Census 

In March of 2022, the Census Bureau released the results of its analyses of the quality of the 2020 Census. The Census conducts two analyses, a Post-Enumeration Survey (PES) and a Demographic Analysis (DA). Both of these analyses estimate the accuracy with which the Census has counted the nation’s population and population groups. The PES uses a sample survey to estimate the population size while the DA uses vital records and other types of data.  

Nationally, only 0.24% of the entire population was missed in 2020. Some states, however, experienced higher miscounts than others. The map below shows which states had undercounts and overcounts. Six states had undercounts, including Arkansas, Florida, Illinois, Mississippi, Tennessee, and Texas. Arkansas and Tennessee had approximately 5% of their populations missed, about 1 in 20 residents, and undercounts in Florida and Texas cost the state’s congressional seats.3 States that were overcounted include Delaware, Hawaii, Massachusetts, Minnesota, New York, Ohio, Rhode Island, and Utah. Overcounts in Minnesota and Rhode Island have appeared to have gained the states congressional representatives. 

Diagram

Description automatically generated

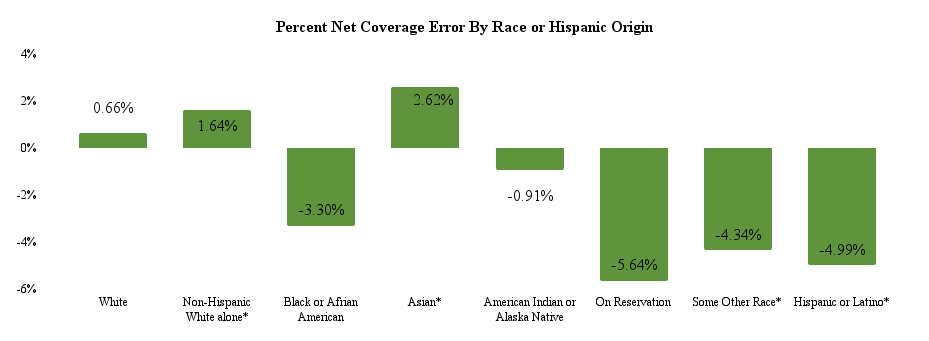
Certain demographic groups were also undercounted and overcounted. By race or Hispanic origin, the Census undercounted those who self-reported as Black, Hispanic or Latino, American Indian or Alaska Native, and “some other race” American Indians or Alaska Natives living on reservations were undercounted at the highest rate. Racial groups that were overcounted include those that reported as non-Hispanic white alone and Asian. When compared with the 2010 Census, groups that were undercounted or overcounted at statistically significant rates include non-Hispanic white alone, black, Asian, some other race, and Hispanic or Latino. 

Source: United States Census Bureau4

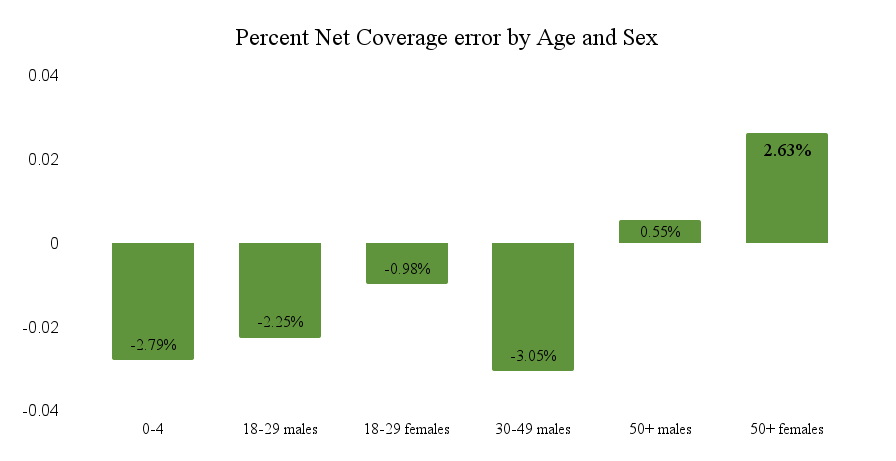
By age and sex, those 50 years and over were overcounted. Children aged 0 to 4, both males and females aged 18 to 29, and males 30 to 49 were undercounted. 

Source: United States Census Bureau5

Additionally, homeowners were overcounted in the 2020 Census by 0.42%, while renters were undercounted by 1.5%.

Many researchers, including us at rbouvier consulting, rely on Census data for accurate information regarding the sociodemographic characteristics of the region we study. While any undertaking as large as the Census is bound to have its issues (and the Census has attempted to rectify some of its prior errors), it is unsettling to see traditionally underrepresented groups continue to be underrepresented. This concern is compounded when we consider “differential privacy,” a practice by which the Census Bureau attempts to preserve the anonymity of residents from small geographic areas, a topic of one of our upcoming blog posts. The decennial Census is one of the best and most reliable sources of sociodemographic statistics we have. Nonetheless, it is worth “ground truthing” it with local results wherever possible.

References

1Prewitt, K. (2019). The 2020 Census: Unprecedented Challenges & Their Implications. American Academy of Arts & Sciences. https://www.amacad.org/news/2020-census-challenges-implications, retrieved on May 19, 2022.

2Jennifer Reichert & Dale Kelly. (2021, March 1). Adapting Field Operations to Meet Unprecedented Challenges. United States Census Bureau. https://www.census.gov/newsroom/blogs/random-samplings/2021/03/unprecedented-challenges.htmll

3Mike Schneider & Associated Press. (2022, May 19). In 2 states, 1 in 20 residents were missed during U.S. Census. PBS News Hour. https://www.pbs.org/newshour/politics/in-2-states-1-in-20-residents-were-missed-during-u-s-census

4,5 United States Census Bureau. (2022, March 10). Census Bureau Releases Estimates of Undercount and Overcount in the 2020 Census [Government]. Census.Gov. https://www.census.gov/newsroom/press-releases/2022/2020-census-estimates-of-undercount-and-overcount.html#:~:text=The%20PES%20found%20that%20the,not%20statistically%20different%20from%20zero

Blog post by – Averi Varney

What You Need To Know About Maine’s Recycling Reform

What You Need To Know About Maine’s Recycling Reform

By Kayley Weeks

Maine lawmakers have passed the nation’s first extended producer responsibility law for packaging materials made out of materials such as plastic, cardboard and paper. The new law will require producers of products that are sold in Maine to pay a fee based on the type of packaging material they adopt for their products. While the law targets all types of packaging material, it is primarily meant to mitigate the impacts of plastic. 


Photo: Plastic waste on the ground” by Ivan Radic is licensed under CC BY 2.0.

Plastic is currently the most common material used for packaging. According to the Natural Resource Defense Council, 300 million tons of plastic are produced each year worldwide. Plastic was mass-produced for the first time after World War II.1 Companies preferred manufacturing plastics over traditional materials due to plastics’ overall versatility and affordable cost, resulting in the “Plastic Boom.” The rapid rate of plastic production did not leave significant planning time for the proper disposal of this material. In most municipal waste processing facilities, the majority of plastics are not recyclable. 

Before Maine passed the extended producer responsibility law, municipalities were financially responsible for processing any waste created by packaging materials. Municipalities generally send their recyclable waste to a processing facility. These facilities contract brokers to sell the material on the raw material market.2 It has been common practice for difficult to recycle waste to be sold and shipped to other countries that have their own waste disposal and processing laws. There is a common misconception that all recyclable waste is ethically disposed of, but hard-to-recycle waste often ends up in landfills in developing countries or unregulated dump sites resulting in harm to the people and environment. 

Extended producer responsibility creates an incentive for producers to use packaging that is more sustainable and less costly to recycle or dispose of. Without such an incentive, producers will continue to use what is of least cost to them, leaving disposal costs to fall on the shoulders of consumers and municipalities. 

In July 2017, China, the country that until then had been the primary buyer of the United States’ recycling material, banned the import of many types of foreign waste under Operation National Sword. Other bans followed. The impact of those bans reverberated throughout the world.  

Waste disposal costs increased sharply. In 2019, according to a report conducted by the Maine Department of Environmental Protection, managing waste from packaging materials cost Maine municipalities between $16 million and $17.5 million each year.That cost is then passed on to taxpayers.

Maine’s new law requires private companies to pay in advance to cover the cost of the disposal of accumulated packaging materials. The stewardship program achieves this by requiring producers to pay into a fund based on the amount and recyclability of their products. The collected funds will be used to reimburse municipalities for eligible recycling and waste management costs. 

Since Maine’s law was passed, Oregon and Colorado have recently implemented their own extended producer responsibility laws, meeting Canada and many European countries who have had similar programs for years. This new legislation could help to decrease property taxes throughout the state, because taxpayers will no longer be responsible for covering the cost of packaging waste disposal. But, do not expect to see an immediate change. Due to the complexity of the reform and the large number of impacted stakeholders, the law will not formally go into effect for another 18 months. Municipalities will most likely receive their first payments in 2027. 

This is an example of what economists call “internalizing the externality.” By incorporating the cost of proper disposal into their production costs, producers are incentivized to develop packaging that is less costly to properly dispose of, and consumers may be prompted to buy products that are less damaging to the environment. Incorporating the full economic costs – financial, environmental, and social – into the price of a product will lead to more responsible long term decisions. 

Plastic was first mass-produced post-World War II. Then it surged again in the 1960’s and 1970’s 1. Consumers preferred plastics over traditional materials due to plastics’ ability to be produced in many different shapes and sizes, overall versatility, affordable cost and sanitation. These characteristics led to the rise of plastic, otherwise known as the Plastic Boom. The rapid rate of plastic production did not leave significant time to properly plan the best approach for disposing of this material. Today, plastic is the most common material used for packaging.

In the past, municipalities were required to pay for their own recycling or try to sell it on in the waste market. China, historically, has sorted waste and  reimbursed municipalities for valuable items. Now, municipalities have to pay other countries to take their waste, and the majority of that waste ends up in landfills in developing worlds, or unregulated dump sites. Not properly disposing of plastic waste is harmful to the environment. This is an unpleasant awakening to Americans due to the conjured up reality that there is a serious exportation problem. 

What exactly is producer responsibility? Producer responsibility will require that the companies that make products sold in Maine,  pay a fee per ton of packaging material that they create based on how recyclable the packaging is. The idea is that material that is easy to recycle will cost less, while harder-to-recycle materials will require a larger fee. The fees will then be reimbursed to municipalities. 

Producer responsibility creates an incentive for producers to use packaging that is more sustainable and easy to dispose of. Without any incentive, producers commonly cut corners to save money by using cheaper materials to package their products. 

Since January 2018, this practice has taken a toll on municipalities because China began to refuse to take any foriegn waste. Cities and towns have to pay more for recycling since China’s ban because there is no place for hard to recycle materials to go. 

In June 2021, Maine passed a new law requiring private companies to shell out the cost to dispose of packaging waste. Maine is the first state in the nation to pass this sort of legislation, meeting other countries around the world who have had similar programs for years. This new legislation could help to decrease property taxes throughout the state. But, do not expect to see an immediate change.

The law was originally drafted by the Maine Department of Environmental Protection in 2019, and was finally passed last summer. Due to the complexity of the reform and the large number of impacted stakeholders, the law will not formally go into effect for another 18 months. Municipalities will not catch sight of their first payments until 2027. 

Blog Post by Kayley Weeks.

1 Rogers, Heather. “A Brief History of Plastic – The Brooklyn Rail.” The Brooklyn Rail, May 2005, https://brooklynrail.org/2005/05/express/a-brief-history-of-plastic. Accessed 24 June 2022.

2 US EPA. “Recycling Basics | US EPA.” US Environmental Protection Agency, 21 December 2021, https://www.epa.gov/recycle/recycling-basics. Accessed 13 July 2022.

3 Natural Resources Council of Maine. “New Maine Law Will Shift Recycling Costs to Producers of Packaging Waste.” 13 July 2021, https://www.nrcm.org/sustainability/new-maine-law-shift-recycling-costs-to-producers-packaging-waste/. Accessed 8 July 2022.

Rising seas, rising problems: Using locally relevant data to prepare solutions.

Rising seas, rising problems: Using locally relevant data to prepare solutions.

What is a Nor’Easter?

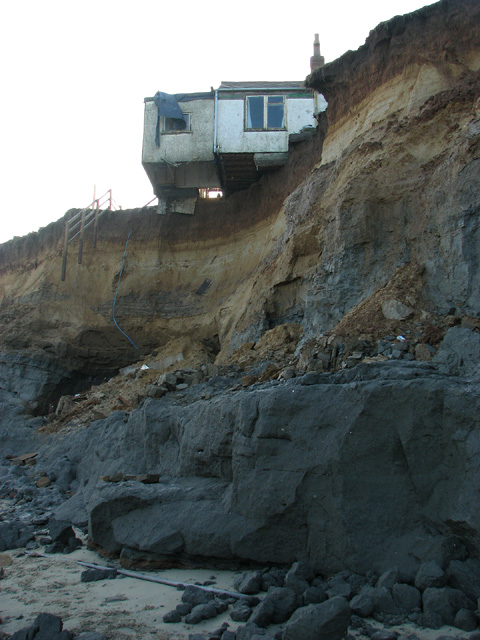
In January of this year, coastal communities on the East Coast were hit with a Nor’easter that set record snow falls in Boston. The storm brought more than just snow, with severe winds, power outages, and flooding. Nor’easters are a type of storm caused by low pressure moving along the coast. Pressures from a storm moving along the coast cause strong winds to push water toward the shore. Some coastal areas in the state were completely underwater around high tide from the storm surge flooding. Waves toppled over seawalls, flooding streets. The island of Nantucket saw the worst of it. There were even reports of young men using a canoe to travel through the flood streets of Nantucket. Storm surge from the nor’easter also caused significant erosion to the beaches along the coast. Local papers in Boston have reported on stories of storm surge erosion cases on Cape Cod where houses fall into the sea. One house in Truro, MA lost twenty 20 feet of Earth underneath it. It was standing on pilons for months as surge after surge eroded the remaining due, as local planning officials tried to decided how to move the historic building. It was moved at the time of this writing.

The Issue 

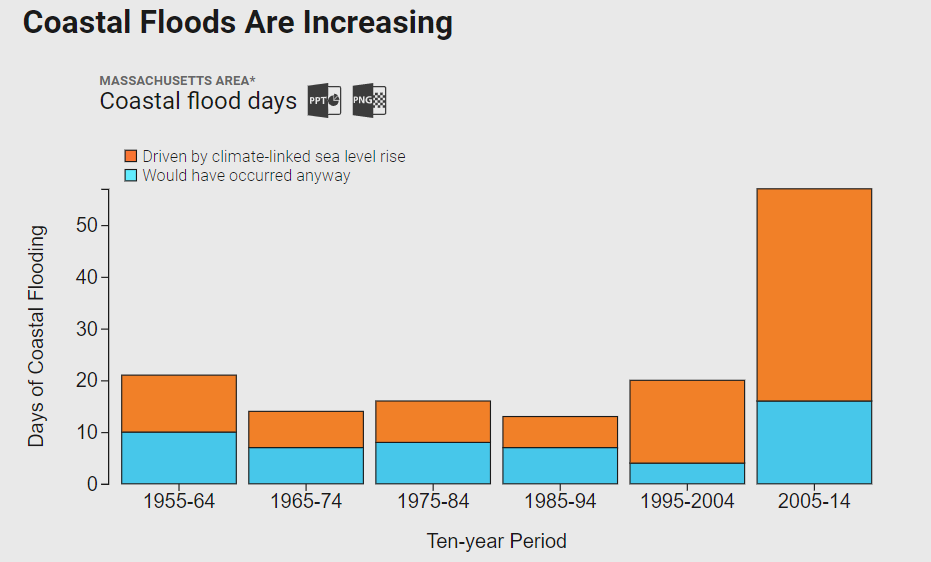
While nor’easters are an event that New England has long been familiar with, climate change has already begun to exacerbate the severity and frequency of these storm events, along with their consequences. Storm events, extreme high tides, and rising seas intensify flooding and put vulnerable communities at risk. The number of coastal flood days in Massachusetts, shown in the graphic below, increased drastically in the last two decades.

Findings from 2016 from at Climate Central study covered by the New York Times, via https://riskfinder.climatecentral.org/state/massachusetts.us?.

Solutions & Our Contributions 

It is becoming increasingly clear how important it is for communities to prepare for a changing climate. As the implications of climate change come to a head, effects will be felt disproportionately across populations, communities, regions, and industries. It’s vital that we assess the areas in which we are vulnerable and are resilient. 

rbouvier consulting recently partnered with the Southern Maine Planning and Development Commission (SMPDC) to assist in their economic resilience planning project for coastal York County, where we were tasked with conducting a socio-economic impact assessment of sea-level rise and storm surge to six coastal communities in southern Maine. 

Geospatial experts from GEI Consultants were also partnered on the project. With capabilities of today’s geospatial technology, GEI Consultants were able to provide us with the physical vulnerabilities of the project area at different sea-level rise and storm surge scenarios. They combined data on businesses, roads, and other important infrastructure with floodplains to produce geospatial layers and other data products that show what of the infrastructure in the area will be impacted at 1.6 and 3.0 feet of sea-level rise.This information allowed us here at rbouvier consulting to determine what culturally and economically significant infrastructure is at risk of flooding or impaired access, such as economic service areas or beaches that draw tourists into Maine. 

Using business-level data on sales revenue and employees, along with data on local demographic and economic conditions, rbouvier consulting was able to assess how sea-level rise will affect output and employment in the area. We determined what industries in the area are most at risk based on the businesses that are within floodplains, and related the risks posed to those industries to the health of the local and regional economies. Conducting a socio-economic impact assessment of sea-level rise tailored to the local conditions of the communities in the project area allowed us to pinpoint areas of economic vulnerability and resilience, and subsequently determine a number of adaptation and mitigation strategies we feel best prepares these communities for a changing climate. 

If you’re interested in talking to rbouvier consulting about climate change solutions and the types of services we offer, please send us an email.

Blog Post by Averi Varney.

Fourth quarter 2021 and first quarter 2022 journal roundup!

Fourth quarter 2021 and first quarter 2022 journal roundup!

This quarter, I focus on three recently published articles that highlight the value of environmental goods and services: regulations to combat the emerald ash borer, the value of agricultural land, and the value of wetland restoration. 

Hope, Emily; McKenney, Daniel; Pedlar, John; Lawrence, Kevin; MacDonald, Heather. 2021. “Canadian efforts to slow the spread of Emerald Ash Borer (Agrilus planipennis Fairmaire) are economically efficient.” Ecological Economics, vol. 188. 

Emerald ash borer” by NatureServe is marked with CC BY-NC 2.0, via Openverse.

The emerald ash borer is an invasive insect that kills most species of ash tree. Managing the spread of the pest can be very expensive, with inconsistent results. The United States Department of Agriculture has actually removed federal regulations designed to slow the spread of the emerald ash borer, citing the high costs and the uncertain benefits. Canadian agencies have likewise been attempting to determine whether the benefits of regulation exceed the cost. The authors developed a model simulating the spread of the emerald ash borer under various conditions, and then modeled the likely effect of different regulations on that spread. Finally, they determined the economic impact of the emerald ash borer by calculating the cost of removing trees in urban areas and replacing 50% of them. (They did not model the cost of insecticide application due to the complexity of modeling such application at a national level.) For rural areas, the authors calculated the cost of the emerald ash borer by using the stumpage value of the trees. 

Regulations designed to slow the spread of the emerald ash borer include limitations on transporting products containing wood from ash trees, treatments for products that are transported, and periodic audits. As the “true” efficacy of the regulations is unknown, the authors modeled the regulations at varying levels of efficacy. Finally, they then determined the net present value of the regulations. Results demonstrate that, even if regulations are only 25% effective at slowing the spread of the emerald ash borer, benefits outweigh the costs. This is the case even though the authors did not include the economic value of a healthy forest. If that were included, the benefits of those regulations would likely be much larger.

Agricultural landscape certification as a market-driven tool to reward the provisioning of cultural ecosystem services

Borrello, M.; Cecchini, L.; Vecchio, R.; Caracciolo, F.; Cembalo, L.; Torquati, B. 2022. Ecological Economics vol 193. 

File:Bessac 16 Polyculture 2013.jpg” by JLPC is marked with CC BY-SA 3.0.

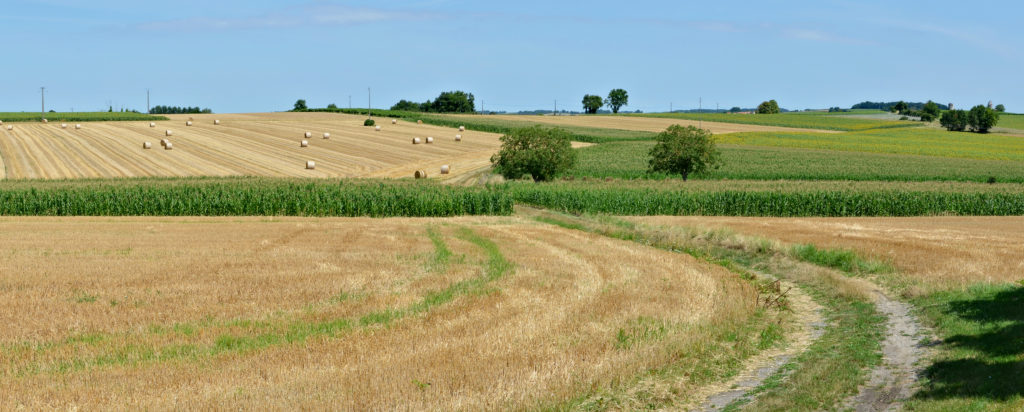
One of the primary difficulties that agricultural landowners face is the high cost of keeping their land in agriculture, relative to other land uses. And yet, agricultural land provides benefits to society beyond just the value of the food produced on that land. It is a classic example of an environmental externality. This article examines the potential of issuing a “traditional agricultural landscape certification” for the preservation of olive groves in Italy. They found that such a certification commanded a price premium in the market, indicating that the cost to farmers of keeping their land in agriculture could be partially rewarded through the market. 

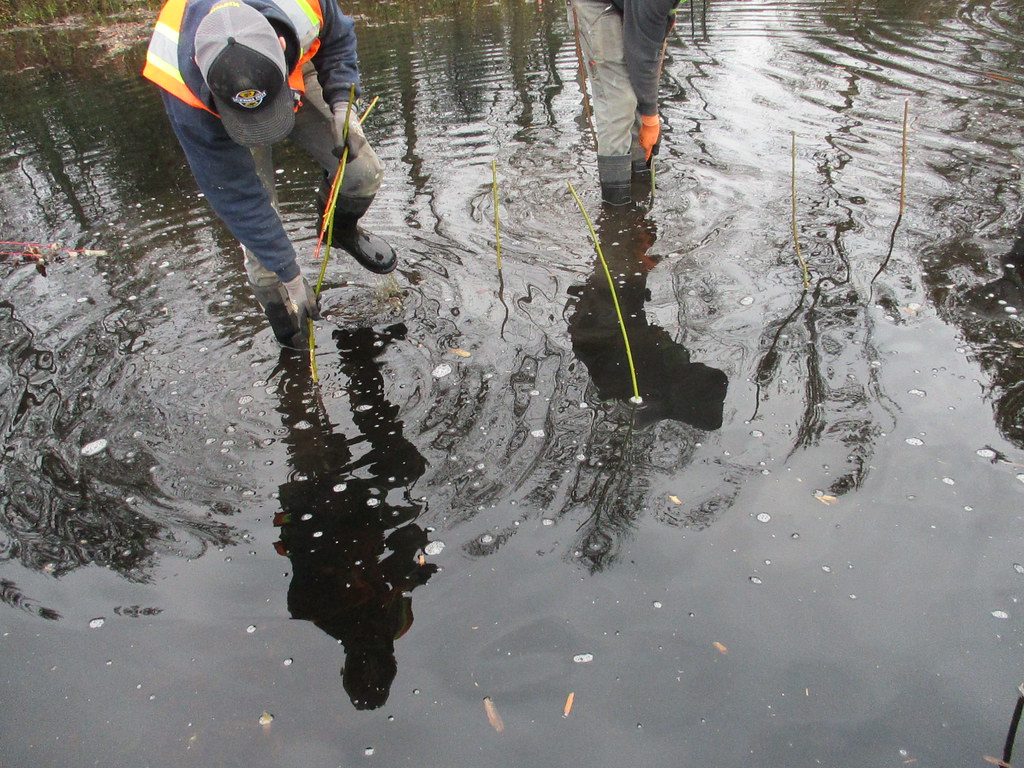
Richardson, M.; Liu, P.; Eggleton, M. 2022. “Valuation of Wetland Restoration: Evidence from the Housing Market in Arkansas,” Environmental and Resource Economics 81:649–683.

Planting live stakes in standing water” by WSDOT is marked with CC BY-NC-ND 2.0.

Continuing with the theme of valuing environmental goods and services, this article examined the value of wetland restoration (through the Wetland Reserve Program) by looking at the housing market in Arkansas. This article adds to the literature on the economic value of wetlands by looking at temporal variations in the housing market relative to the starting and ending date of wetland restoration projects. Therefore, rather than looking at the value of an already existing wetland, this article examines how improvements in wetland quality could impact surrounding property values. Their research finds a substantial increase in property values – an average of 6 to 10%!  They also find that the wetland size and type were likely to influence the magnitude of the effect, with forested wetlands having a larger positive impact on housing values than pond, lake, or emergent wetlands. Interestingly, open water wetlands had a much smaller effect than non-open water wetlands. The reasons why are unclear.

Point-Nonpoint Nutrient Trading in the Long Island Sound Watershed

Point-Nonpoint Nutrient Trading in the Long Island Sound Watershed

Photo credit: Long Island Sound Study

rbouvier consulting is proud to announce the publication of Feasibility of Point-Nonpoint Nutrient Trading in the Long Island Sound Watershed, the culmination of a year’s long project with NEIWPCC (formerly known as the New England Interstate Water Pollution Control Council). The report summarizes the potential for nutrient trading to meet the goals of the Long Island Sound Study.

Our work, together with the work of folks from NEIWPCC and Footprints in the Water LLC determined that “expanded water quality trading is unlikely to be an effective tool to meet water quality goals under current ecological, economic, and regulatory conditions in the Long Island Sound watershed.”

To read more about the project, including our report, here.