Category: Uncategorized

France’s Yellow Vest Riots: Death Knell for a Carbon Tax?

France’s Yellow Vest Riots: Death Knell for a Carbon Tax?


By the time this blog post comes out, the “yellow vest” riots in France may be old news. But this fall, people took to the streets of France, seemingly angered by a proposed fuel tax. Opponents of carbon taxes were quick to declare victory: if France, a country with a fairly liberal (in the American sense of the word) populace, reacted with such anger to a proposed carbon tax, then clearly it is not a sound policy.

Not so fast. As any student of political science could tell you, context matters. France’s president, Emmanuel Macron, was fairly unpopular among certain groups before the tax was proposed. Part of this was class based: Macron is seen by some as the “president of the rich,” partially due to the repeal of a tax on the very wealthy, which only served to stoke already simmering class resentments. The proposed fuel tax would have hit low-income rural voters the hardest, a constituency that was already smarting under an oil tax that Macron had implemented earlier in the year. If Macron hadn’t already angered that constituency, would the riots have occurred? It’s hard to say. France, after all, is a party to the Paris accord, and Macron was elected in part based on his promise to do something about climate change.

Secondly, not all carbon taxes are created equal. The proposed policy in France took the shape of a fuel tax, one that would have increased the already high price that French consumers pay at the pump. A certain amount of an increase in fuel price is pretty much unavoidable. As greenhouse gases are formed by the combustion of fossil fuels, policies to reduce the use of those fuels is naturally going to impact, in one way or another, the users of those fuels. But the proper design of such a policy could help lessen their impact.

Carbon taxes can be placed at several different places in the “life” of a carbon atom. A tax on gasoline, which is what France proposed, is placed at the very end of the production and consumption process. It would affect low income and rural consumers more heavily, because those users consume disproportionately more gasoline. (Macron didn’t help his case by suggesting that rural folks carpool more often, displaying a serious misunderstanding of the lives of his rural constituents.)

Other forms of a carbon tax could be imposed (at least theoretically) during the extraction process: i.e., when the fossil fuel is extracted from the earth. In France, however, there is very little oil and natural gas production. Most of France’s energy comes from fossil fuel free nuclear power. While that means that France’s energy sector is much less carbon intensive than other countries’, it doesn’t leave them much wiggle room to reduce emissions elsewhere.

Thirdly, the way the revenue from the tax is “recycled” matters.  By recycling the revenue and returning it to households in some way, governments can reduce the regressivity of the carbon tax. Current proposals include reducing the payroll tax, reducing the capital gains tax, or simply returning it to households on a per person basis, much like the Alaskan Permanent Fund.  You can read more about revenue recycling in our earlier blog post.

The difficulty is that such schemes are complicated, and hard to explain to the general public. Add that complexity to Macron’s apparent communication problems, simmering class resentments, and increasing economic stress, and you have a problem. But don’t assume that all carbon taxes are politically infeasible. Like most other policies, they need to be designed – and communicated – effectively.

Image: Lionel Allorge [GFDL (http://www.gnu.org/copyleft/fdl.html), CC BY-SA 3.0 (https://creativecommons.org/licenses/by-sa/3.0) or FAL], from Wikimedia Commons

2018 Fourth Quarter Journal Reviews: Property Values

2018 Fourth Quarter Journal Reviews: Property Values

Property Value Impacts of Wind Turbines and the Influence of Attitudes toward Wind Energy

Richard J. Vyn

Land Economics, Volume 94, Number 4, November 2018, pp. 496-516 (Article)

This article uses a hedonic analysis to investigate the effect of wind turbines on property values, and whether that effect seems to differ between communities that are opposed to wind power, versus those that support it. Past studies investigating the effect of wind turbines on property values have been mixed, with some studies showing negative effects, while other studies show no effects. This study hypothesizes that there may be other characteristics of the communities that influence any property value effects. Results indicate that property value impacts in communities that were opposed to the wind farm prior to construction were greater than those in communities in which no prior opposition was found. The author concludes that turbine impacts in a jurisdiction “may be influenced by attitudes toward wind energy in that jurisdiction, and that public perception regarding wind energy and its potential impacts is a prominent contributing factor to the nature of observed impacts on property values.”

Rising sea levels and sinking property values: Hurricane Sandy and New York’s housing market

Ortega, Francesc and Taṣpınar, Süleyman, 2018.

 “Rising sea levels and sinking property values: Hurricane Sandy and New York’s housing market,” Journal of Urban Economics, Elsevier, vol. 106(C), pages 81-100.

This paper analyzes the effects of Hurricane Sandy on the New York City housing market from 2003-2017. Their results indicate a persistent negative effect among properties within the flood zone that had not been damaged by the storm. In contrast, properties that had been damaged by the storm suffered an immediate negative price effect that was up to three times as great, followed by a gradual convergence to the level of nondamaged properties. The authors conclude that the housing market in New York City has been affected by greater awareness of flood risk following Hurricane Sandy.

Mercury pollution, information, and property values

Chuan Tang, Martin D. Heintzelman, Thomas M. Holsen

Journal of Environmental Economics and Management 92 (2018): 418-432.

Continuing our property value theme, Tang et al. investigated the influence of mercury pollution on property values, as an implicit value of mercury pollution reduction. They looked at approximately 83,000 property transactions in New York State over a 9-year period.  Results demonstrated that property values within one mile of a lake for which an advisory had been issued were 6-7 percent lower than similar properties surrounding a lake for which no such designation had been made. Their results “can serve as a partial indication of the benefits of the Mercury and Air Toxic Standards (MATS), which includes the first mercury emission standard in the United States.” It’s worth noting that the Environmental Protection Agency is currently reviewing a proposal that could undermine the MATS.

Eliciting preferences for urban parks

Toke Emil Panduro, Cathrine Ulla Jensen, Thomas Hedemark Lundhede, Kathrinevon Graevenitz, Bo Jellesmark Thorsen

Regional Science and Urban Economics Volume 73, November 2018, Pages 127-142

Yet another article investigates the effects of urban parks on adjacent property values.  The authors estimate residents’ willingness to pay for park availability in Copenhagen, Denmark, by investigating the effects of distance to a park and park density on apartment rents.  The authors claim: “‘Parks provide recreational opportunities for urban residents and visitors. Urban green spaces furthermore provide climate regulation functions, harbor biodiversity and provide other ecosystem services… However, in the absence of thorough insights into the values of urban green space, the need for such regulation [to provide urban parks] may be neglected whenever new neighborhoods are planned and developed.” One of the interesting things about this paper is that it investigates both proximity to and density of green spaces and finds that both measures are important and capture different components of willingness to pay.  The article finds that proximity to green space has a positive effect on apartment rents (meaning that people are willing to pay more to live near a green space, all else being equal), and that there may be a “saturation point” beyond which an additional park does not add significantly to household welfare. 

The Avoided Cost of Stormwater Remediation

The Avoided Cost of Stormwater Remediation

Here’s something to think about during the next rainstorm: where does all that rainwater go?  For most of us, it’s not something to which we give more than a passing thought. But if you’re concerned about saving money and protecting water quality, it’s worth a closer look.

In many older New England towns, the infrastructure that conducts sewage from our homes to our wastewater treatment plant is old, crumbling, and not up to today’s needs. During relatively dry times, the system works pretty well.  Pipes convey sewage to the sewage treatment plant where it is treated and then released.  But during times of intense rainfalls, that excess water running down our streets to our storm drains can overwhelm those older pipes. During those times, the pipes essentially overflow, and raw sewage mixed with stormwater can make it into rivers and oceans.  These discharges are called combined sewer overflows, and despite heroic efforts to separate them, they do still exist (see our prior blog posts Money Down the Drain Part 1 and Part 2).  Recently in Portland, Maine a heavy rainfall, combined with human error, contributed to a million-plus gallon spill of partially treated sewage directly into Casco Bay.

There are several different strategies for a city or municipality attempting to address its stormwater issues. Coming up with those strategies may be a job for an engineer. Prioritizing those strategies, on the other hand, may be a job for an economist: someone who can weigh the costs and the benefits of each, keeping in mind that there may be hidden costs and benefits to each alternative that are not immediately obvious. Determining the financial costs of each strategy is relatively easy.  But coming up with the benefit – the return on investment, or bang for your buck –  isn’t as straightforward.

Stormwater management can bring economic and fiscal benefits in terms of “avoided costs.” By reducing the flow of stormwater that needs to be treated, the municipality saves the money that it would otherwise have needed to treat it.  That’s not insubstantial.  Treating a gallon of stormwater can cost substantial amounts of money in operations and maintenance costs (think electricity, chemicals, filter replacement, sludge disposal, etc.). Every gallon of runoff that is diverted from the treatment plant is that much money saved.

In addition to avoided treatment costs, there are avoided property damage costs.  Floods that are caused or exacerbated by excess stormwater (sometimes called “urban flooding”) can cause damage to property. A 2014 study in Cook County, IL, found that chronic and systematic urban flooding had led to property damage claims of over $773 million over a five year period.  This number is likely a significant underestimate, as flood insurance only covered a small portion of all damage costs.  Less easily measured are the costs of disruption to emergency services like police, fire and ambulance services,  and losses to private companies  that not only may lose inventory but business as well.

The benefits of dealing with stormwater include the avoided costs of treatment, as well as the avoided costs of flood damage, but that’s not all.  Other categories of avoided costs include the costs of treating waterborne diseases. Untreated wastewater that flows into our rivers, streams, and oceans can carry with it diseases and pathogens.  Treating those diseases in humans has economic costs.  A recent study published in the journal Environmental Health estimated that the “economic burden” – defined as both direct treatment costs and indirect opportunity cost, such as lost productivity – of recreational waterborne illness cost the nation upwards of $2.2 – $3.7 billion annually.  That’s a lot of money.

Moreover, contaminated wastewater that flows into our waters can have a detrimental effect on industries that depend on clean water.  For example, a recent study from the University of Maine estimated that the closures of shellfish beds caused by toxic algal blooms linked to pollution from combined sewer overflows led to at least $3.6 million in lost revenue over a nine year period. That amounted to approximately 27.4% of revenue from those beds.

Estimating the avoided costs associated with a particular stormwater management option depends on how much stormwater is treated or diverted relative to the baseline, as well as the location attributes of the site and the impacts untreated stormwater can have on the environment it is released into.  It isn’t always easy to calculate, but it is information that is needed in order to know the true benefits of a stormwater treatment system.

Stay tuned for upcoming blog posts on the benefit of green infrastructure in stormwater treatment and the fiscal impacts of urban flooding.


Third Quarter Journal Review

Third Quarter Journal Review

1. “Estimating the Societal Benefits of Carbon Dioxide Sequestration Through Peatland estoration,” Ecological Economics Volume 154, December 2018, Pages 145-155, Emily Pindilli, Rachel Sleeter, Dianna Hogan

We at rbouvier consulting are very interested in ecosystem restoration, and in particular, methods that economists might use to measure the benefits of ecosystem restoration.  This article presents an analysis of the benefits associated with managing and restoring the Great Dismal Swamp National Wildlife Refuge in Virginia (particular appropriate for a dismal scientist!).  The GDS is a forested peatland.  While there are those who might look at the swamp and appreciate it solely for its aesthetic appearance, a system such as the GDS can provide essential ecosystem services in terms of carbon sequestration.  In fact, the authors find that actively managing and preserving the swamp can provide benefits to society of up to $524 million, above and beyond management costs.  The authors use the social cost of carbon (link to blog post here) to monetize the benefits.

2. “Neither Boon nor Bane: The Economic Effects of a Landscape-Scale National Monument,” Land Economics, Volume 94, Number 3, August 2018, pp. 323-339, by Paul M. Jakus, Sherzod B. Akhundjanov.

The designation of a national monument has been a source of controversy over the past several years.  Proponents of national monuments point to the potential increase in tourism that such a designation can bring, whereas opponents point out the restrictions that are sometimes made (such as restrictions on hunting or ATV use).  This article looks at the Grand Staircase–Escalante National Monument in Utah, and examines trends in economic activity both before designation and after designation.  Their conclusion is that, at least in this case, designation as a national monument neither helped nor hindered the per capita income of the region.  However, as the authors point out, economic efficiency is only one metric by which to measure the success of a national monument designation.  It would be helpful to study other recently-designated national monuments to see if their results are transferable.

3. “Population health effects and health-related costs of extreme temperatures: Comprehensive evidence from Germany,” Journal of Environmental Economics and Management 91 (2018) 93–117 by Martin Karlsson and Nicolas R. Ziebarth.

Given some of our current projects, we have been very interested in the local costs of climate change-related events. While this article was published in Germany, it nonetheless gives us an idea of the health related costs of extreme temperatures – and a possible methodology to follow.  The article finds that extreme heat “significantly and immediately increases hospitalizations and deaths.”  The effects decline over time, as one might imagine, but the economic impact include not just the cost of treatment, but lost productivity as well.  An interesting methodological result is that  their findings hold whether they use standard economic models or epidemiological models – good news for those doing their research in either field.

4. “Urban Stream Restoration Projects: Do Project Phase, Distance, and Type Affect Nearby Property Sale Prices?” Land Economics, Volume 94, Number 3, August 2018, pp. 368-385, by Maya Jarrad, Noelwah R. Netusil, Klaus Moeltner, Anita T. Morzillo, J. Alan Yeakley

We were also interested in this article, which investigated whether urban stream restoration projects affected nearby property values.  We have done some work related to this in the past. The authors find positive effects on property values for properties located in close proximity to storm water, floodplain, and revegetation projects, but negative effects for wetland restoration projects.  They identify two counter-vailing effects that could help to explain: a “benefit” effect, whereby the restored area conveys benefits onto nearby properties (such as storm  water mitigation or flood reduction) and a “damaged goods” effect (wetland restoration can often necessitate large – temporary –  aesthetic damage that might affect a property’s sale price). 

Vulnerability Assessements: What are they and do you need one?

Vulnerability Assessements: What are they and do you need one?

Vulnerability assessments are a hot topic in sustainability and climate adaptation circles these days.  It is the process of looking at a system and trying to figure out what might make that system fail under particular circumstances so that you can begin to find ways to mitigate those possible failures.  The system might be anything from a computer network, to a power grid, to a neighborhood.   When it comes to climate adaptation the assessment generally looks at how a system, such as town, or piece of infrastructure, would be impacted by certain effects of climate change.  It can be an indispensable tool in climate adaptation planning.

Most vulnerability assessments utilize a four-step process.  These steps include[i]:

  1. Scope
  2. Collect
  3. Assess
  4. Apply

Scope. This is the planning part of the process.  It is probably the most time consuming and you should allow plenty of time to complete it as it is the foundation of your assessment.  It includes defining the parameters of the system you are looking at, who needs to be involved, and asking question such as:

  • What asset or system are you choosing to focus on?
  • What are the climate stressors that will impact it?
  • Who might be impacted by these climate stressors on this particular asset or system?
  • What information do you not have that you might need to collect?
  • What resources might you need to help complete your assessment?


This may seem like a lot of information to come up with, but it may be a little less intimidating if we use an example, such as the main road through a medium sized town. What assets are we focusing on?  The main road through our downtown.

  • What are the climate stressors? The road floods more and more frequently due to a nearby river overflowing when large rainstorms and hurricanes come through the region.
  • Who is impacted? People who live near or who have businesses in the downtown area.  Emergency vehicles that need to have a fast route to those in need.  People from other towns who travel through on their way to other places and those who come to town to do business.
  • What information do you need to collect? The frequency of flooding and assessments of past damage. Perhaps a count of cars that travel the road.  Documentation of alternate routes of travel should the road be flooded.  A list of your possible actions for mitigation of the flooding, along with potential costs if you already have some in mind.  Often people do not have solutions at this stage but will be using the assessment to determine what issue should be dealt with first.
  • What resources might you need? Do you have the inhouse expertise, personnel, or time available to do the assessment? You may need to contract with a consultant or other experts to assist with the process.
  • Other important questions include how to fund the assessment and what your timeframe is for completion.

Keep all this information, the questions and your answers, handy.  This is a roadmap for your assessment.  You will need to refer to it as you move through the process.  You may discover that you need to ask more questions, or you may find that something you felt was relevant no longer is.

Collect. This is just what it sounds like.  It is collecting the information and data you need to do the assessment.  Some of the information might already have been collected by other people.  Rainfall amounts, storm frequency, or weather history can often be provided by government agencies.  But there are other items that may not be readily available.  How many emergency call responses have been delayed by the road flooding?  You may need to do a survey of residents to find out how many times they needed to find alternate travel routes.  Or perhaps you need to set up equipment to count the number of cars that travel the roads.  If you are collecting financial information on past damages you will need to know what your parameters are – are you counting just damage to the road itself, will you include losses to business, or the value of the extra travel time for residents who need to find alternate and possibly longer routes.

Assess.  Once you have collected the information you need, it is time to put that information to use.  You will want to use this information to answer questions about which areas of the road are most vulnerable.  Is there one area that is damaged more often than other parts of the road?  Are there certain populations that are most vulnerable to the impacts?  At this point you may also find that some of your assumptions were incorrect and there are other issues you were not aware of.  Again, you may want some experts to assist you on this.

Apply.  Now you have your information, you’ve figured out which parts of the road are most at risk, how much future flooding could cost your town, and who is most affected by it.  You can now use this information to prioritize your solutions.  This might be determined by cost such as which repairs or mitigation techniques will prevent the costliest damage.  Or you might base it on human need, giving emergency vehicle access priority.  It might also be time based.  Is there a part of the road that is most at risk right now?

A vulnerability assessment is a vital tool when it comes to assessing the impacts of climate change and how to plan your adaptation strategies.  But once it is done, don’t set the assessment aside.  It will be a roadmap that you can refer to as you move forward.  Once you have implemented your first solution you will need to review what to do next.  You may also want to use it as a reference for future assessments as an accounting of what worked and what didn’t.  It can continue to provide you with the information you need to best meet the changes and challenges that climate change will present in the future.

————

[i] This four-step assessment process is based on the vulnerability assessment process as presented by the National Oceanic and Atmospheric Administration (NOAA) at the Adaptation Planning for Coastal Communities conference in Brunswick, Maine in the spring of 2018.

Photo by Daniel Case

Second Quarter Journal Review

Second Quarter Journal Review

 1. The Economic Impacts of Climate Change: Richard S J Tol, Review of Environmental Economics and Policy, Volume 12, Issue 1, 1 February 2018, Pages 4–25, https://doi.org/10.1093/reep/rex027:

This article focuses on aggregate indicators of the effects of climate change on total economic welfare and on the distribution of those welfare impacts. The author argues that while climate change may, initially, have “net positive” benefits in the aggregate, the impacts turn globally negative after a certain degree of warming is met. Moreover, the negative effects of climate change will fall disproportionately on developing nations: first, because of their exposure (less developed countries typically have a larger share of their economic activities directly related to environmental resources); second, because less developed countries tend, on the whole, to be located in hotter areas; and finally because less developed countries often lack access to medicines and technologies that could help temper the negative impacts. 

The latest issue of Environment and Development Economics is devoted to investigating the links between poverty and climate change.

2. The economics of urban afforestation: Insights from an integrated bioeconomic-health model: Journal of Environmental Economics and Management 89 (2018) 116e135

Switching gears slightly from the impacts of climate change to ways of potentially mitigating it, a recent article in the Journal of Environmental Economics and Management looked at “urban afforestation,” the idea of planting trees in urban areas. Urban afforestation, the authors claim, generate co-benefits in terms of public health and well-being. Using a tree planting program in New York City, the authors use an integrated bio-economic and health model to demonstrate that annual net benefits range from $10.24 to $12.10 per tree planted, even after accounting for costs and any ill health effects from pollen.  These benefits arise from carbon sequestration, air pollution reduction, storm water reduction, and aesthetic effects.  


3. Genuine Economic Progress in the United States: A Fifty State Study and Comparative Assessment: Mairi-Jane V. Foxa , Jon D. Ericksonb,C,  Ecological Economics 147 (2018) 29–35

How do we measure economic success?  GDP, the conventional measure of the success of an economy, doesn’t do a very good job of measuring economic welfare. To give just a few examples, GDP doesn’t include volunteer or household labor, doesn’t account for pollution, and is not adjusted for what might be called the “depreciation of natural capital.” The Genuine Progress Indicator, or GPI, was developed to address those short-comings.  A recent article in the journal Ecological Economics presents the first 50-state estimate of the GPI in the United States. Interestingly, over 90% of the variation between the states can be explained by the depletion of non-renewable energy resources, personal consumption expenditure, and motor vehicle crashes.  The article makes for very interesting reading. 


First Quarter Journal Highlights: Regulations Behaving Badly

First Quarter Journal Highlights: Regulations Behaving Badly


A recent article in the Journal of Environmental Economics and Management (JEEM) coined a new (albeit clunky) phrase: the macroeconomic environmental rebound/backfire effect.  This effect occurs when a “green improvement,” such as an energy efficiency program, results in less of an environmental improvement than expected. This is not due to unrealistic expectations, but due to what the authors term the substitution, wealth, and sectoral reallocation effects. The substitution effect occurs when the green promotion lowers the price of the green good relative to the dirty one, and so households adjust their consumption towards the green good and away from the dirty one.  So far, so good.  But the wealth effect can work in the opposite direction. As households experience an increase in their buying power due to the now (relatively cheaper) green good, they will purchase more of everything in what economists term their “consumption bundle” – including dirty goods. Finally, the sectoral reallocation effect occurs when firms reallocate their resources between the dirty and green sectors.  Depending upon the magnitude and intensity of these three effects, a green improvement could actually lead to an increase in pollution. (Environmental rebounds/backfires: Macroeconomic implications for the promotion of environmentally-friendly products. Juin-JenChang, Wei-NengWang, Jhy-YuanShieh, Volume 88, March 2018, Pages 35-68)

Also in JEEM this quarter is a very interesting article looking at the potential for “spillovers” when regulating multiple pollutants, such as greenhouse gases and particulate matter.  A regulatory spillover is when a regulation aimed at one pollutant has an effect (either positive or negative) on the emissions of another pollutant.  For example, carbon dioxide and particulate matter are both formed through the combustion of fossil fuels, so a policy aimed at reducing the emission of greenhouses gases may reduce particulate matter at the same time. That’s an example of a positive spillover.  However, as the article points out, it’s also possible that a regulation may have a negative spillover; for example, switching from fossil fuels to biomass may reduce emissions of carbon dioxide, but increase emissions of nitrogen oxides or particulate matter.  Failure to account for policy spillovers, either positive or negative, can lead to poorly targeted regulations. 

The authors consider a transboundary pollutant (such as carbon dioxide) and a local pollutant (such as particulate matter).  For policy options, they consider emissions taxes and emissions quotas.   They find that policies to reduce greenhouse gases can lead to positive spillovers for local pollutants if the technologies that are used to reduce both are complementary. This is not a surprising result. However, they then look at whether there is an international agreement in place to reduce greenhouse gas emissions. Their results suggest that if there is such an agreement in place, emissions of the local pollutant may actually increase if countries behave strategically (I.e., increase their emissions in the hopes of getting larger quotas), or when the revenue from a tax is kept within its borders. Policy spillovers in the regulation of multiple pollutants Pages 114-134 JEEM Stefan Ambec, Jessica Coria Volume 88, March 2018        

Of real interest to us in New England is a recent article that appears to suggest that the Regional Greenhouse Gas Initiative (RGGI), geared at reducing carbon emissions in some northern states, actually is associated with an increase in carbon emissions elsewhere (a phenomenon called “leakage” that occurs when regulations designed to reduce emissions in one geographic area actually increase emissions somewhere else).  While emissions decreased overall, authors found, the decrease was partially offset by an increase in neighboring states.  They conclude that such leakage means that we cannot attribute quite as much of a decrease in emissions to RGGI as originally thought.  Leakage in regional environmental policy: The case of the regional greenhouse gas initiative Harrison Fell and Peter Maniloff JEEM Volume 87, January 2018, Pages 1-23 

And finally, a slightly different type of article: several researchers from the University of Pisa in Italy investigated the links between per capita income and new cancer incidence by looking at a cross-sectional dataset from 122 countries.  They found that the incidence rate of all-sites cancer increases linearly with per capita income, even after controlling for population ageing, improvement in cancer detection, and omitted spatially correlated variables.  The article lends further support to the so-called “cancer transition hypothesis,” a theory that links economic development with a shift in the onset of cancers from those linked with infectious diseases to those linked with other types of risk factors.  To quote from the article itself: “our analysis shows that the cancer epidemic cannot be explained solely by higher life expectancy, by better statistics and by regional peculiarities: rather, a significant role must also be attributed to environmental degradation and life-styles. Unfortunately, our regressions are unable to distinguish between the two” (p 388).  Unfortunate, indeed.  Ecological Economics 146 (2018) 381–396 Economic Growth and Cancer Incidence T. Luzzati , A. Parenti, T. Rughi 

Keeping the Lights On Doesn’t Mean More Pollution

Keeping the Lights On Doesn’t Mean More Pollution

Photo – Creative Commons/Flickr Amy the Nurse

In August of 2017, Energy Secretary and former governor Rick Perry proposed to strengthen subsidies to coal- and nuclear-fueled electricity plants.  Why?  According to his proposal, coal and nuclear power plants are indispensable to our national security by virtue of the fact that they can store energy on-site. And, since the past few years have seen declines in both coal and nuclear facilities in the United States, the concern is that the nation’s electricity grid will be less reliable in the future. The proposal would have guaranteed cost recovery and a fair rate of return for generators that can store at least 90 days’ worth of energy on site.  Fortunately, the Federal Regulatory Commission rejected it.  Even so, it’s still worth looking at the pros and cons of such a proposal.

More power outages and more disruptions would, of course, harm our energy-intensive economy. As the recent spate of hurricanes (including high winds in my home state of Maine) have shown, such energy disruptions can be costly. In fact, 2017 was the costliest year in terms of economic damages from natural disasters in the US.

Would subsidizing coal and nuclear facilities really have been the best solution? To answer that, we need to take a deeper look.  When I teach cost-benefit analysis, I encourage my students to consider the baseline – what would have happened in the absence of the policy or proposal in question. The number of coal and nuclear plants in this country has been declining for decades. The decline can be attributed to several factors, including environmental regulations, but mainly the declines are due to market forces (low electricity prices, declining electricity demand, and new supplies from natural gas) and aging infrastructure. Without taking a close look at the finances of the plants in question, we can assume that at least some of these plants would have been likely to follow.  Increasing subsidies to already struggling nuclear and coal plants would likely have been just another case of throwing good money after bad.

When considering the costs and benefits of the proposed plan, there would have been several different categories, each accruing to different groups.  The beneficiaries of the plan would likely have been owners and shareholders of the qualifying coal and nuclear plants.  Their consumers, as well, may have benefited from a lower average wholesale price of electricity; however, the proposal recommended adding a surcharge to consumers’ bills in order to cover the costs. According to the analysis done by Resources for the Future, the drop in the wholesale price of electricity would not have been enough to cover the surcharge.

Moreover, practitioners of cost-benefit analysis need to carefully consider all the costs and benefits of a proposal, not just those that are easily monetized.  A complete analysis of the costs and benefits of Secretary Perry’s proposal should include the damages caused by pollution from coal and nuclear-powered plants to humans and agriculture. (While the generation of electricity from nuclear plants does not create air pollution, the mining for uranium does create environmental destruction.) Such external costs are in reality a passive subsidy that coal and nuclear plants have enjoyed for decades. An additional subsidy would exacerbate the problem. According to the analysis done by Resources for the Future, the proposed plan would have immediately increased sulfur dioxide and nitrogen oxide, two pollutants generated by the combustion of fossil fuel.  This increase in emissions is linked to an increase in premature deaths caused by respiratory diseases such as chronic bronchitis and emphysema. Once environmental costs are factored in, net benefits to society would have been decidedly negative.

The next question is: would the subsidies have alleviated the problem of grid instability? The answer to this question actually lies in the question itself.  Is there really a problem of power disruption caused by declining coal and nuclear plants? Some recent research by the Rhodium Group says no.  Researchers examined the data collected by the Department of Energy whenever an electricity generator experiences an outage or a disturbance.  Results indicate that disruptions in fuel supply were responsible for less than 1 one hundredth of one percent of lost customer service hours between 2012 and 2016.  The remainder were caused by disruptions to energy distribution  Primarily, those disruptions were caused by severe weather, not by supply disruptions.  The FERC ultimately agreed when it rejected Secretary Perry’s proposal.

However, the FERC did agree that the reliability of the grid was an issue looking into.  If the goal of Secretary Perry’s proposal was to increase the reliability of the grid – not just to prop up nuclear and coal – there are several less costly and ultimately beneficial ways of doing so.  One such possibility is to replace our nation’s aging energy-related infrastructure, much of which dates to the 1950s and 60s. Energy infrastructure actually received a “D+” on the 2017 report by the American Society of Civil Engineers. Upgrading the energy infrastructure would come with many ancillary benefits.

A second alternative would be to invest in distributed energy and microgrids.  Distributed energy is the use of small, decentralized power generation and storage systems. While larger utilities consider the rise of distributed energy to be a threat to the existing system, the greater use of distributed energy could actually increase the resilience of our current, outdated system.  However, doing so will require innovations in monitoring, modeling, “smart switches,” and other technologies to manage peak demand and integration.

A third possibility is to invest in better long-term energy storage. Lithium ion batteries may be our best choice for now, but other storage technologies, such as flow batteries or zinc air batteries.  But by far the best alternative – one that should be a crucial part of any solution – is energy conservation.  A unit of energy conserved is one that doesn’t need to be generated.  You don’t get much more reliable than that.

Webinar: The Cost of Everything & the Value of Nothing

Webinar: The Cost of Everything & the Value of Nothing

Dates: 9/21, 10/19, 11/16 & 12/14 – 12:00PM – 1:30PM

Cost:  $25 session/$80 full series

Registration:  HERE

Join economist Rachel Bouvier for a four-part webinar series entitled, “The Price of Everything and the Value of Nothing: What Environmental Professionals Should Know About Economics.” A firm grasp of economic principles is necessary to be able to articulate the full social value of environmental preservation and conservation. Using economic language helps ensure that environmental protection is on equal footing with other, more marketable services.

Live webinars will be broadcast every third Thursday of the month (with the exception of December), starting September 21 and ending December 14 from 12:00pm to 1:30pm. Presentations will be one hour, with a half hour for an interactive question and answer period.

Archived presentations will be available for registrants to access at any time.

September 21, 2017: Introduction to Economics for Environmental Professionals

What does it mean to put a value on the environment and why is it important to know how to do it?

  • Why put a value on the environment?
  • An economist’s view of the world
  • Basic concepts of economic value


Octoberr 19, 2017: Tools that economists use to “value” the environment

Economists use a variety of tools to value the environment. Learn what those tools are and how they are used to put a value on environmental benefits.

  • Use value / Non-use value
  • Stated Preference / Revealed Preference


November 16, 2017: Cost-Benefit analysis and discounting

Cost-benefit analysis and discounting are integral to creating accurate accountings of value. This webinar touches on what they are and how to use them.

  • Steps in a Cost-Benefit Analysis
  • An Introduction to Discounting
  • Value of a Statistical Life


December 14, 2017: Using Economics in Advocacy and Communication

Learn how to use economic information to make your work meaningful to your intended audience.

  • How to determine your audience.
  • How do you make the information meaningful to them?
  • What forum is most useful to communicate the information?


The Social Cost of Carbon: Implications for Maine (Part II)

The Social Cost of Carbon: Implications for Maine (Part II)

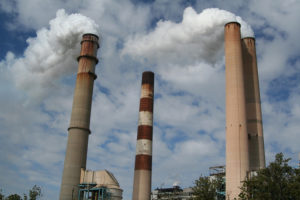
My most recent blog post, “The Social Cost of Carbon: Implications for Maine (Part I),” went into some of the details behind calculating the social cost of carbon – a number that is used to illustrate the economic damages anticipated by climate change and therefore linked to carbon dioxide emissions.
This blog post will be a bit more policy oriented.  Once we arrive at a social cost of carbon, what do we do with it?  How can we use it to reduce the amount of carbon that’s emitted into the atmosphere?

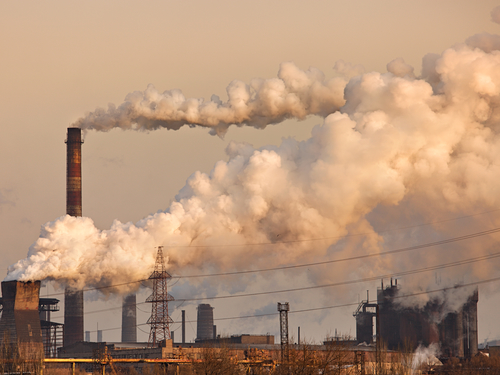
Essentially, there are three policy options to reduce climate change.  One is what economists like to call “command and control.”  This is standard regulation – where each company or industry is given a standard beyond which they are not allowed to pollute.  If they are found to have polluted beyond that standard, they are then (typically) fined a certain amount.

The second and third option are what economists call “incentive-based regulation.”  Rather than give companies or industries a hard and fast limit, this type of regulation gives the regulated community an incentive to reduce emissions.  The incentive could be in the form of a subsidy for each unit of pollution reduced, or, alternatively, a tax system could be put in place.  In that case, the firm’s incentive to reduce pollution is the avoided tax on each unit. (From an economic perspective, there is actually no difference between a tax and a subsidy when it comes to determining the “efficient level” of pollution.  From a political perspective, of course, there is a huge difference.)

A third option is to implement a trading scheme.  The idea is simple: firms are distributed a certain number of permits or “rights” to pollute. (The permits could be initially distributed free of charge, or the permits could be auctioned off.)  Firms that could then reduce a unit of pollution more cheaply than the permit price would do so, and sell the unused permit on the market to other firms that have a more difficult time reducing pollution.  The firm’s incentive to reduce is the price that they get from selling their permit.  Creating a market like this is not without its difficulties, and markets for pollution have met with varying degrees of success.  One pollution market close to home is RGGI, the Regional Greenhouse Gas Initiative, which is the topic of one of my earlier blog posts.  The revenue gained from auctioning off the permits goes to energy-saving initiatives.

One of the major difficulties in both of these is to set the “right” price – too low, and not enough firms will reduce their emissions; too high, and it can create political dissatisfaction and a drag on the economy.  (A side note: unbridled carbon emissions are already creating havoc with Maine’s economy – but that will be the topic of a later blog post.)

A second major difficulty (what I like to call the “liberal’s paradox) is that implementing a carbon price will necessarily be regressive – the burden of the tax will be felt disproportionately among lower-income households.  A price on carbon – whether it’s a tax or a permit system – will raise the price of carbon-intensive goods and services, such as fossil fuels and conventionally-generated electricity.  Low-income households spend a higher percentage of their income on fuel and electricity than do higher-income households.  What to do? It turns out that what you do with the revenue from the tax (“revenue recycling”) can moderate or even negate the regressivity of the tax.

The think tank Resources for the Future (RFF) has published a series of articles addressing this very topic.  I’m going to address three possibilities for revenue recycling.  Two of them have to do with reducing taxes on other things – shifting the burden from taxing economic “goods” (like income and labor) to taxing economic “bads” (like pollution).  (After all, if part of the point of a tax is to alter behavior, why tax good things like income and employment?)  The third has to do with returning the revenue directly to the people.  So I’m going to focus on three alternatives: tax carbon, but lower the tax on labor income; tax carbon, but lower the tax on capital income; and tax carbon, but return the revenue to the people in the form of a dividend or a lump-sum rebate.

RFF analyzed these three alternatives for their impact on different income groups to see which groups were “better off” after the tax and revenue-recycling scheme, and which were “worse off.”  (It’s important to note that RFF did not analyze the effects of reducing carbon emissions – the primary goal of the tax, after all! – on the welfare of each of these groups.  It’s well-known that low-income populations are the most sensitive to climate change, and therefore the group most likely to benefit from a reduction in greenhouse gas emissions.)

What they find, summarized, is this: the labor tax recycling scenario found that almost all groups ended up slightly worse off (the groups’ welfare or well-being declined by less than a half of a percent), but that the highest income group ended up with the biggest decline in welfare.  The capital tax recycling scheme benefited the highest income group, while generating a reduction in welfare for all other income groups of less than one percent.  And the lump sum rebate scheme benefited the lowest income group by more than three percent, while harming the highest income group by almost two percent.  From an efficiency perspective, the capital tax recycling scheme is the most efficient (that is, the policy that “distorts” the economy the least).

I’ll replicate RFF’s graphic here:

Source: 2015. Williams, Roberton C., Burtraw, Dallas, and Morgenstern, Richard. “The Impacts of a US Carbon Tax across Income Groups and States.” Washington, DC: Resources for the Future).

Why such differences?  Largely, it has to do with where individuals earn their income.  Generally speaking, high-income households get a larger percentage of their income from capital (stocks, bonds, and property), while middle-income people rely more heavily on income from labor.  Low-income people typically get a larger percentage of their income from transfer payments, which not only include food stamps and unemployment insurance but also Social Security.  That explains why lowering the tax on capital would exacerbate the regressiveness of the carbon tax, while lowering the tax on labor would be slightly progressive.

What about here in Maine?  I wasn’t able to get data directly for Maine, but only for New England as a whole.  As it turns out, all the schemes end up diminishing the welfare of New England residents, but the lump-sum rebate actually performs the worst.  Why?  The answer mainly has to do with the fact that, overall, New Englanders receive a relatively high percentage of their income from capital as opposed to labor.

How about Maine, though?  Is that the case? Looking at the Bureau of Economic Analysis for 2015, I noticed that Mainers as a whole received about 60% of their personal income from wages and salaries.  An additional 22.5% comes from personal transfer receipts, which include Social Security benefits, medical benefits, veterans’ benefits, and unemployment insurance benefits.  (By far the majority of these personal transfer receipts are retirement income and income from other benefits, excluding unemployment insurance benefits and income maintenance programs such as general assistance.)  A little less than 18% comes from capital and property income.

By contrast, Connecticut receives about 66% of its personal income from wages and salaries, 12.8% from transfer payments, and over 21% from capital and property. This implies that lowering the tax on capital would not benefit the average Mainer as much as the average person from Connecticut – but without doing the calculations, I can’t be sure whether the labor tax recycling scheme or the lump sum dividend would be more or less welfare changing.

Of course, the election on November 8 may have made this a moot point.  Passing a carbon tax (or fee, as some like to call it) has had a difficult time in the past, and the election of Donald Trump has made that possibility more remote.  Any action now is likely to arise at the state level – which is why state level analysis is crucial.  Climate change will likely have a disproportionate effect on those who are least able to protect themselves.  Any actions to mitigate climate change should not increase the injury.