Category: Uncategorized

Rachel’s 2Q 2024 Journal Round Up

Rachel’s 2Q 2024 Journal Round Up

Ceccacci, A., Lopes, A. F., Mulazzani, L., & Malorgio, G. (2024, April 11). Recreation in coastal environments: Estimating the non-market value of fishing harbors. Ecological Economics. https://www.sciencedirect.com/science/article/pii/S0921800924000946?via%3Dihub 

This article looks to quantify the positive externalities around small scale fisheries (SSF). Specifically, the article focuses on the recreational value of harbors by analyzing whether small-scale vessels represent an attractive amenity for individuals engaging in outdoor recreation. To accomplish this, datasets with wide EU coverage were matched with information on individuals’ number of visits to coastal environments with fishing harbors near the local destination. Research on this topic has been rather limited, and this study represents one of the first papers on the topic. 

The results suggest that both small scale fisheries and their fleets provide value to the local area. Ultimately, the study finds that each vessel has an average value of $0.054 per visit. That may sound small, but when all the visitors to an area are added together, the benefit can be rather significant. The study also found that the presence of local harbors and fleets attracts local visitors. Furthermore, it was found that without the presence of SSFs, Sweden would suffer a $53.59 million economic loss, while Spain and Greece would suffer $205.46 million and $4.23 billion respectively. In terms of policy, this could justify providing additional support to local fishing industries to help foster their positive economic externalities. If you are interested in this topic, check out the link for more information and detail on the study. 


Sims, K. R. E. (2023, June 5). Towards Equity in Land Protection: Agricultural and Resource Economics Review. Cambridge Core. https://www.cambridge.org/core/journals/agricultural-and-resource-economics-review/article/towards-equity-in-land-protection/6445DABDC880C903884CE2A00EAC5819 

Land protection is a valuable tool for ecosystem sustainability. As concern for the environment grows, land trusts and land conservation has been a common solution promoted to address these problems. However, there have been concerns regarding the effect of land conservation on equity. This article, by Kathleen Sims, reviews three key concerns about how land protection policies may impact equity and assesses evidence for each, utilizing global literature as well as examples from the United States. The article examines pathways forward to potentially improve the equity of land protection policies.

The three main issues outlined are as followed: lost local economic development or increased local poverty due to the costs of land protection, economic development opportunities that differentially reinforce existing inequalities of capital, skill, or social hierarchies, and patterns of access to the benefits of protected land that reflect and reinforce broader social disparities.

The article goes into significant detail about the presence of and need to address each issue. For example, regarding lost economic development, Sims advocates for more research into investigating systemic predictors of local benefits stemming from land protection. Furthermore, Sims believes that equity considerations should be given more weight in the broader conversation. 

More broadly, the article describes the need for more research into how equity can be balanced against legitimate environmental concerns. If you are interested in learning more, check out the link for the full report. 

Journal Round Up for Q1 2024

Journal Round Up for Q1 2024

Climate Change Adaptation in Local Municipalities

The sharp rise in extreme weather events such as floods and heat waves have increased the need for governing bodies to adapt. The general consensus indicates that municipal governments are best positioned to do this given their unique and proximate knowledge of local infrastructure needs. Accordingly, this study comprises a literature review of local municipalities in all seven continents to find common trends and challenges with climate change adaptation measures. The study placed an emphasis on larger cities due to their strong fiscal capacities as well as their increased likelihood of attaining international funding. Specifically, the paper focuses less on policy measures and more on the capacity of municipalities to implement adaptation measures. 

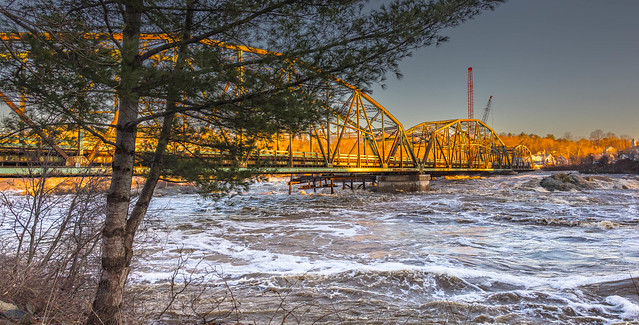
Bridge Closed
Bridge Closed” by Me in ME is licensed under CC BY 2.0.

The paper found several general trends. For one, adaptation policy, to varying degrees, has been hampered by both political and financial limitations. This is especially pronounced in smaller municipalities, where lack of capital and human wherewithal significantly limits the potential for adaptation measures. Overall, financial difficulties can largely be attributed to a small tax base and a lack of economic diversification.

In addition, it was found that efforts were hampered by uncertainty around which levers of government were actually responsible for crafting and implementing adaptation measures. Generally, localized government would presumably be responsible, but centralized government across numerous states have hindered local efforts or attempted to fill the void themselves. Ultimately, the literature suggests there are significant administrative and political impediments in the way of crafting and implementing climate change adaptation measures. 


Wind Turbines and Property Values

As demand for alternative energy sources increases, the construction of wind turbines has steadily increased over the years. However, one of the biggest concerns surrounding wind turbines is concern over its potential impact on property values. To address this concern, this article engages in a comprehensive study on the topic. Previous studies around adverse property values have come back with starkly different conclusions, so there is no general academic consensus on this topic. This study differentiates itself by focusing specifically on wind farms/wind turbines. 

Overall, the results found that for properties within 1.89 miles of a wind turbine, property values changed by -0.68%, while properties farther than 2.8 miles had virtually no effect. For policy makers, this study helps alleviate concerns about the construction of wind farms as well as indicating what level of compensation may be necessary for homeowners. Ultimately, this topic needs to be studied more, as the author notes, but this article nevertheless represents an important milestone on the potential adverse effects of wind turbines on property values. 


Impact of Wind Energy on Air Pollution

Renewable energy has become an increasingly desirable alternative to fossil fuels due to its ability to better preserve natural resources, reduce pollution, and create cheaper energy. Subsequently, investment in renewable energy has increased substantially over the last decade, and wind energy now accounts for 8.2% of the American energy market. While there is a general consensus that wind energy is more environmentally friendly, there is less consensus on what form that takes. 

This study, conducted in Texas, assesses the impact of wind energy on air pollution. To conduct the analysis, data was collected across three primary categories: electricity generation, meteorological and air quality, and emergency department admission records. The authors hypothesized that because wind generation does involve the releasing of emissions wind energy would be associated with less pollution across the state. Results demonstrated that the generation power from wind energy was associated with less air pollution. However, results varied both spatially and temporally.  The results found that areas near coal plants benefited more from wind energy (in terms of less air pollution than areas that were not close to existing coal plants. The effect of wind generation on air pollution rates appears to increase in magnitude (i.e., become more negative) when more wind generation comes during grid-uncongested hours (such as at night, when demand for power is lower) and during off-peak wind periods. The results suggest that wind energy is associated with less air pollution, resulting in greater human health benefits, but that reducing grid congestion could increase the size of that effect. 


Effect of Lake Water Quality on Home Prices

Lakes are an appealing environmental amenity that provides recreational, aesthetic, and ecosystem benefits. Environmental economists (like us at rbouvier consulting) are often asked to measure the economic benefit of cleaner lake water quality. While there have been many studies demonstrating the relationship between cleaner lake water quality (typically measured by water clarity) and property values, there have been few studies that have attempted to determine whether that relationship is constant across regions of the United States. 

This study attempts to answer that question by using data from Zillow’s former Transaction and Assessment Database. Unfortunately for researchers, results suggest that no, there is no one definitive “number” that can be used to assess the relationship between water quality and property values. The elasticity of property values to lake water quality (i.e., the responsiveness of property values to lake water quality) varies significantly across regions, and any attempt to “smooth out” the relationship by looking at larger spatial scales could result in bias. Also of interest (at least, to practitioners) is that the choices made by the investigator in modeling the relationship may also be a source of variability. 

The authors therefore recommend caution in “transferring model results across spatial boundaries.” For those reasons, any further attempt to determine the relationship between lake water quality and property values should be conducted at a local scale. 


Rachel’s journal selections were summarized by Connor Feeney this quarter from the following publications.

https://le.uwpress.org/content/100/1/109

https://www.journals.uchicago.edu/doi/10.1086/689702

https://www.journals.uchicago.edu/doi/abs/10.1086/727357?journalCode=jaere

Fourth Quarter Journal Round Up!

Fourth Quarter Journal Round Up!

The selected article summaries for this quarter focused on carbon taxation and the natural capital of forests and their impacts. As always, the articles are selected from peer reviewed academic journals.  

—-

Castellanos, K. A., & Heutel, G. (2019, May 6). Unemployment, labor mobility, and climate policy. Journal of the Association of Environmental and Resource Economists Volume 11 Number 1, January 2024 JAERE https://www.journals.uchicago.edu/doi/full/10.1086/725482

Unemployment, Labor Mobility, and Climate Policy assesses the impact of a carbon tax on the economy. More specifically, this study looks at the relationship between a hypothetical carbon tax and employment in the United States through the usage of a mathematical economic model. For the purposes of the study, a $35 carbon tax was examined. The authors ran two scenarios, one with complete labor mobility and one without any mobility.

The results indicated that a $35 dollar carbon tax would have a minimal impact on aggregate employment (-0.18% with no labor mobility and -0.17% with labor mobility) in either scenario. However, once broken down by sector, sectors involved in the extraction of fossil fuels faced significant losses in employment. Meanwhile, sectors involved in the production of green energy benefited from the carbon tax – resulting in an increase in employment. To dampen these results, the authors recommend pairing a carbon tax with a distributional mechanism targeted towards communities that would be most adversely affected.

With carbon taxes becoming increasingly looked to as a potential solution to climate change, understanding its impact on employment will be critical for policymakers and the public going forward. 

—-

Grover, I., O’Reilly-Wapstra, J., Suitor, S., & Hatton MacDonald, D. (2023, June 22). Not seeing  the Accounts for the Forest: A systematic literature review of ecosystem accounting for forest resource management purposes. Ecological Economics. https://www.sciencedirect.com/science/article/pii/S0921800923001854 

This article is a  review of case studies that use the System of Economic Ecosystem Accounting (SEEA).  SEEA is only one approach to ecosystem accounting, which is an attempt to integrate physical accounts of natural capital with economic values. SEEA first arose out of concern that standard measures of economic prosperity ignored the role of natural capital and ecosystem services.  . The review identified a total of 35 empirical publications, and categorized them into the following global regions: Europe (43%), Asia (20%), America (14%), Africa (9%), Oceania (3%) and Europe/Asia (3%) as well as global scale assessments (8%) at regional (54%), country (23%) and multi-country (23%) levels. The largest percentage of publications covered forest specific ecosystems. Of these, a large portion focused on forest management and policy. The authors identified various gaps and challenges in how SEEA is applied, especially in countries lacking governmental and institutional support – arguably the regions that might benefit the most from a rigorous accounting of natural capital. The authors conclude with a call to make ecosystem accounting more widely available and accessible. 

—-

Zhao, J., Daigneault, A., Weiskittel, A., & Wei, X. (2023). Climate and socioeconomic impacts on Maine’s forests under alternative future pathways. Ecological Economics, 214, N.PAG. https://doi.org/10.1016/j.ecolecon.2023.107979

This article looks into the future of Maine’s forests under several “shared socioeconomic pathways,”* taking factors into account such as climate change and forestry management. The study integrated a harvest choice model with varying socioeconomic and climate change conditions to estimate the future of Maine’s forest sector under a range of possible scenarios. 

The results indicated that without increased rates of harvesting, forest ecosystems would grow by 144% on average over the next 80 years. It was found that climate change had a positive effect on forestry growth. In fact, forest growth was the highest under the highest emission scenario (164%). Economically, harvesting was expected to peak in 2060 in most scenarios, before declining at various rates up to 2100. Interestingly, the researchers found that socio-economic drivers had larger effects than climate change on timber harvest and carbon stocks.  

*The shared socioeconomic scenarios were developed by an international group of scientists and economists to map out potential futures, given certain assumptions about socio-economic responses to the “representative concentration pathways” (RCPs). The RCPs themselves were developed by an international group of researchers to describe different concentrations of greenhouse gasses in the atmosphere. 

Biking: A Budding Environmental Economist’s View

Biking: A Budding Environmental Economist’s View

Biking has exploded in popularity in recent years around the world, both as a recreational pursuit and as a way to commute. What good does it provide society beyond being just a fun activity? This blog post by our summer 2023 intern, Maddie Nakashian, takes a deep dive in to how has biking impacted the United States and how the biking industry impacts the economy and the environment. Maddie attends high school in Northampton MA.

Biking in American History

Biking has been an integral part of American culture for centuries. Its rich history began with the creation of the “Ordinary”– the comical-looking bike with an enormous front wheel. Americans began importing bicycles from Europe, as safer modifications created the “Safety” model, which resembles the classic bicycle that we all know today. Its popularity surged in the 19th century, as the working class now had an affordable means of transportation, without the use of horses and carriages, which required far more maintenance.

South Park bike rack” by randomduck is licensed under CC BY-SA 2.0.

Bikers were some of the first advocates for better road maintenance, which (quite literally) paved the way for a new and growing industry to take over – the automobile industry. Cars began replacing bikes, and by the 1940s and the introduction of highways, biking became essentially obsolete.

Decades passed like this, until the 1970s, when biking experienced a resurgence. With Veterans returning from Vietnam, Baby Boomers wanting to be “different” from older generations, and the environmentalist movement gaining traction, biking began gaining popularity again. But it was fleeting:  Environmentalist and former Secretary of State Stewart Udall predicted it best:  “…people will cling to their cars because there is no alternative”. For nearly half a century, this remained true. 

Biking Today

The decline in biking has been reversed in recent years, with  the pandemic helping create yet another biking boom. Closed gyms and social distancing inspired many to take on biking as a safely distanced and healthy activity that can easily be done with others. Even if it appears we are moving towards a more sustainably bike-centered world, the boom will only last so long; we are just beginning to enter the bust. People are returning to their cars as their main mode of transportation, and renewing their gyms memberships. 

Environmental Benefits from Biking

While we return to our car-dominated and dependent society, much of the world is yet to understand the benefits of biking and its crucial part in the economy and saving the environment, and just how much it can change the course of our future.

One of the first benefits that people associate with biking is being environmentally friendly. While this is widely appreciated by most, many people do not realize the extent to which biking helps keep our world a greener place. Increasing biking trips over using cars will be crucial to reverse and mitigate the drastic effects of climate change. This is emphasized by the UN Intergovernmental Panel on Climate Change (IPCC), which states that worldwide changes in how we travel is imperative to become a more eco-friendly world.

To start, let’s compare bikes to their counterpart, the car. One obvious fact about bikes is that they don’t emit CO2 or other greenhouse gas emissions, nor do they require fuel. Therefore, using bikes not only limits carbon emissions, but also preserves fuel and prevents it from being depleted so fast.

This image has an empty alt attribute; its file name is Working-bicycle-by-Salim-Virji-is-licensed-under-CC-BY-SA-2.0.jpg
Working bicycle” by Salim Virji is licensed under CC BY-SA 2.0.

However, many underestimate just how big an impact biking can have on depleting carbon emissions and saving fuel. A modest increase in biking worldwide could save between 6 -14 million tons of CO2 from being emitted every year (How Riding a Bike Benefits the Environment | UCLA Transportation). In a world where we are rapidly and exponentially increasing how much CO2 we emit, even small changes can make all the difference in our quickly warming world. 

Additionally, car emissions are emitted at street level, which makes them arguably more dangerous than other emissions due to their proximity to humans. Therefore, reducing car emissions can have a direct impact on human’s health and safety – and one great way of doing that is choosing to bike instead! Furthermore, this same modest increase in biking also has the benefit of saving 700 million to 1.6 billion gallons of fuel (Environmental Impact | U.S. Bicycle Route System | Adventure Cycling Association). This is a major step in preserving what natural resources we have left.

However, there are other large differences in the composition of cars versus bikes, which have major implications on the environment. Cars contain many other types of harmful chemicals, such as antifreeze, VOC’s (volatile organic compounds), heavy metals, ozone, and many more. These chemicals can be deposited on soil and surface waters, which has plenty of adverse effects on ecosystems; by accumulating in ecosystems, these toxic chemicals can easily enter the food chain and worsen the quality of the food we eat.

Obviously, bikes don’t use any of these toxins and chemicals and thus there’s no worry of depositing them into the environment. However, there are other ways to gauge the eco-friendliness of bikes.

Using a bike over a car reduces car congestion — which occurs when cars sit idly while still being in drive —  and noise pollution, which can have major impacts on nearby ecosystems and human health.

Another parameter that bikes can be valued is in their infrastructure and their impact on the environment. Bike paths are significantly smaller than roads, especially highways, use less resources and are also better for the environment than roads, which often cause water run-off and subsequent  ground/water pollution.

Despite all this evidence, some people contend that there are practical reasons not to bike – certain commutes are just too long and burdensome to travel via bike, right? Well, according to one survey (National Household Travel Survey –League of American Bicyclists (bikeleague.org) more than half of all daily trips are sub three miles, which is the perfect distance for a bike ride! Overall, using bikes is far more eco-friendly on many fronts, and also more practical than many give them credit for.

Economic Benefits from Biking

Bikes obviously have a lot of environmental benefits. But, often overlooked are the  economic benefits brought to both an individual and their local/national economy. During the pandemic, the industry experienced a boom like never before, and many used biking as a way to escape the inevitable reclusive lifestyle Covid brought to us all. However, with the pandemic coming to an end, biking popularity is fizzling out. Though, despite some bumps in the road, the industry is now starting to see the light of day and make a healthy recovery back into the market.

The global biking market was valued at nearly 110 billion dollars in 2022, and expected to nearly double its worth by 2030. However, just a market evaluation alone doesn’t show the economic benefits biking can bring. Not only is biking more cost-friendly for the user, but also has massive economic benefits for all of society. To start, biking costs far less for individuals than cars do for myriad reasons. They cost less to manufacture, purchase, and maintain  relative to  cars. To put it into perspective, purchase, operations and maintenance, fuel, and insurance costs for a bicycle approximately $3.00 per 100km traveled; a private car is six times more expensive, at approximately $18.00 per 100km (itdp.org). Other necessary but expensive commodities for cars, such as gas and parking, are not needed for biking.

Amsterdam Bikes” by liber is licensed under CC BY-SA 2.0.

Another major benefit of biking is it keeps you healthy, which, too, has an economic benefit for individuals and society. Being healthier leads to reduced medical bill costs and premature deaths. In Patna, India, a 15 percent increase in trips made by bicycle would reduce premature mortality by 755 lives per year, and save the city $166 million (Making the Economic Case for Cycling, ITDP).

While many could easily figure out how biking is less costly on an individual level, less understood are the economic benefits biking brings on a macro scale. First, biking infrastructure (including bike paths and lanes) can be built quickly and at a lower cost, while employing over four times more employees than it takes to construct a road (itdp.org)! Bike lanes slow down traffic, which allows people to better see storefronts, which could translate to more business: A 2009 study concluded that bikers, on average, spend more money and bring more business in certain areas than those driving vehicles. 

Furthermore, making towns more bike friendly creates more jobs in the national industry, including delivery services, bike tourism jobs, manufacturing and maintenance of bikes, micro mobility services such as Citibike, and countless others. One study conducted by the Institute for Transportation and Development Policy even found that every kilometer cycled generates $0.18 for society, whereas every kilometer driven costs society $0.16.

Certain sectors that utilize cycling more see significant benefits. The delivery sector is a great example: using bikes/E-bikes is more cost effective than using big trucks. One study even found that a dramatic increase in bicycling could save society upwards of 24 trillion dollars collectively, between 2015-2050 (Making the Economic Case for Cycling, ITDP). So overall, biking doesn’t just reduce costs for the individual, but has massive economic benefits – in both saving money and generating revenue – for all of society.

Much of this post has been studying biking and its relation to the economy and the environment. However, something particularly interesting is biking and its crossover of the two. One business which achieves this is the Pedal People, based in downtown Northampton, MA. As the name suggests, they offer myriad different transportation services, notably trash, compost, and recycling pickup, but are often hired to transport other goods as well. This business not only perfectly shows how biking can help the environment, but also how it can add to the economy and provide community service. Expansion has been slow, as the business is trying to open a new chapter in Easthampton, MA, and some associates are even hoping to create a similar business in Norway, Maine, but nonetheless, this bike-powered business has seen steady growth, and in years to come, become a more common model around the state, region, and country.
New England’s Unique Environmental Problem: Lead

New England’s Unique Environmental Problem: Lead

Lead and Solder Products” by colinmford is licensed under CC BY-SA 2.0.

In New England, even though most sources of drinking water are lead free, lead was a common material used for constructing pipes until 1986. Even today, while copper has eclipsed lead as the most common material used for pipes, lead solder can still be used to join copper pipes. Corrosive water can then cause the lead to leach into the drinking water. Lead contamination from drinking water is one of the most common forms of lead poisoning in both New England and across the country. 

Every state in New England still has lead pipes carrying water to houses (as well as lead contamination in schools). In Rhode Island, for example, there are 30,000 known lead service lines that are a contamination risk. Fortunately, New England is taking steps to remedy this problem. There are two “fronts” on which the battle against lead contamination in drinking water is being fought: in public infrastructure, such as schools, and in private residences and businesses, which is more challenging. In terms of schools, Maine, Vermont, and New Hampshire require consistent testing to see if lead is contaminating the water supply. In all three states, tests have come back confirming that a portion of the public school water supply is contaminated with lead. Meanwhile, Connecticut, Massachusetts, and Rhode Island do not require schools to test for lead, although Massachusetts has a robust voluntary testing program. Connecticut, for its part, does require young children to get tested for lead, but does not extend this requirement to schools. Assisted by the Bipartisan Infrastructure Law, states are investing in replacing lead pipes with safe, modern ones. These projects will not finish overnight, but still represent an important step in the right direction. On the federal level, the Lead and Copper regulates the amount of lead and copper in public drinking water, which currently stands at 15 ppb (parts per billion) for lead. However, science (and indeed the EPA) has emphasized that no amount of consumed lead is healthy or safe.

The Environmental Protection Agency recently estimated there are 9.2 million lead pipes carrying water throughout the country. Lead, which is commonly found in paint, ceramics, plumbing materials, gasoline, batteries, and pipes, among other products, has numerous negative health effects if consumed. Adults who consume lead can face high blood pressure, as well as kidney, brain, and reproductive complications. Adults are most commonly exposed to lead through drinking water as well as consumer products. Meanwhile, children who consume lead can face brain damage, slowed growth and development, and even hearing and speech problems. Children are most likely to be exposed to lead through paint dust. To address this long standing problem, the recently passed Bipartisan Infrastructure Law allocates $15 billion towards replacing lead pipes.

The social and physical costs of lead contamination, such as how lead disproportionately harms poor communities, are relatively easy to see, but it is important to consider the economic consequences as well. From an economic standpoint, health externalities such as kidney or brain complications harm the economy in the form of further burdening the logistics and finances of the healthcare system. Meanwhile, stunting childhood development harms long-term earnings, and some studies believe that lead exposure increases crime.  In 2019, lead exposure cost Maine $226.8 million dollars, Connecticut $984.4 million, Vermont $115.9 million, Massachusetts $2.0 billion, New Hampshire $272.9 million, and Rhode Island $257.1 million. This expense includes costs of reduced lifetime productivity, greater health care, education, social assistance expenditures, and premature mortality. State and federal budgets, as well as the private sector all bear a portion of this cost. Ultimately, the exposure of both children and adults to lead contamination is as much an economic issue as a moral one. 

Although the health problems associated with lead in drinking water have been known since at least the late 1800s, the problem still remains. Lead contamination is a prime example of how environmental and economic issues are very intertwined. Both the private and public sectors should continue working to reduce (and eventually eliminate) lead contamination in both children and adults. Doing so would be wise from both an economic and moral perspective. Overall, while lead poisoning might seem like a moral problem, its economic consequences prove that lead contamination is a multifaceted policy issue worthy of attention.

By Connor Feeney


Works Cited:

El-Dib, I. (2021, November 12). Lead exposure poses threat, especially to children, in Rhode Island. The Brown Daily Herald. Retrieved April 12, 2023, from https://www.browndailyherald.com/article/2021/11/lead-exposure-poses-threat-especially-to-children-in-rhode-island 

Frazin, R. (2023, April 4). EPA estimates 9.2 million lead water pipes in US, doles out funding to replace some of them. The Hill. Retrieved April 12, 2023, from https://thehill.com/policy/energy-environment/3933154-epa-estimates-9-2-million-lead-water-pipes-in-us-doles-out-funding-to-replace-some-of-them/ 

 Costa, C. (2022, May 31). All Maine schools are required to test for lead. here’s what they’re finding. newscentermaine.com. Retrieved April 12, 2023, from https://www.newscentermaine.com/article/news/investigations/testing-reveals-alarming-levels-of-lead-in-school-drinking-water-maine-cdc-drinking-water/97-0d23e363-5e9e-4d7c-b12c-259113d20e9a 

Emanuel, G. (2023, February 24). Mass. gets a ‘C-‘ in effort to address lead in school drinking water. WBUR News. Retrieved April 12, 2023, from https://www.wbur.org/news/2023/02/24/lead-water-school-daycare-facility 

Tan, T. (2023, January 8). Lead water pipes in 300 Bennington homes have been replaced in pioneering project. VTDigger. Retrieved April 12, 2023, from https://vtdigger.org/2023/01/08/lead-water-pipes-in-300-bennington-homes-have-been-replaced-in-pioneering-project/ 

Fleisher, C. (2018, July 13). Get the lead out. American Economic Association. Retrieved April 12, 2023, from https://www.aeaweb.org/research/lead-poisoning-health-intervention-long-run-impact-charlotte-north-carolina 

For parents. CT.gov. (n.d.). Retrieved April 12, 2023, from https://portal.ct.gov/DPH/Environmental-Health/Lead-Poisoning-Prevention-and-Control/For-Parents#:~:text=In%20Connecticut%20every%20child%20between,optional%3B%20it%20is%20the%20law.

Lloreda, C. L. (2020, January 14). Lead poisoning hits low-income children harder than their affluent neighbors. Massive Science. Retrieved April 12, 2023, from https://massivesci.com/articles/lead-flint-water-crisis-poverty-income-health-pollution-poor-rich/#:~:text=They%20found%20that%20children%20from,highlighted%20in%20red%20and%20yellow. 

Altarum. (n.d.). Value of lead prevention. http://valueofleadprevention.org/index.php?error=2 

Perls, H. (2022, August 10). EPA’s lead and copper rule: Examining challenges and Prospects – Environmental & Energy Law Program. Harvard Law School. https://eelp.law.harvard.edu/2021/01/lead-and-copper-rule/ 

About Lead. New England Lead Prevention. (n.d.). https://www.newenglandlead.org/about-lead/#:~:text=The%20most%20common%20source%20of%20lead%20poisoning%20in%20New%20England,built%20before%201978%20contain%20lead.

Economics of Climate Change

Economics of Climate Change

Lake Chilwa, Malawi” by U.S. Geological Survey is marked with CC0 1.0.

During the summer of 2022, I created and taught a course entitled “The Economics of Climate Change.” In honor of the 2022 United Nations Climate Change Conference in Sharm El Sheikh, Egypt, I thought I would share the outline of the course and reading materials. 

We began by a brief overview of the physical causes and consequences of climate change, followed by discussion of several guiding questions:

  • How can economics help us to think about and analyze the causes of climate change?
  • How can economics help us to think about and analyze the consequences of climate change?
  • How can economics help us to think about and analyze the costs of climate change mitigation?
  • How can economic policies help us to reduce climate change? and
  • What are the equity considerations surrounding climate change? 

Our primary readings were a teaching module published by the Global Development and Environment Institute at Tufts University, and the latest version of the IPCC (International Panel on Climate Change) report. The citations and links are below. 

  1. Harris, J., Roach, B., and A-M Codur. 2017. The Economics of Global Climate Change. Medford, MA: Global Development and Environment Institute. https://www.bu.edu/eci/files/2019/06/The_Economics_of_Global_Climate_Change.pdf 
  1. IPCC, 2022. Summary for Policymakers. In: Climate Change 2022: Impacts, Adaptation and Vulnerability. Contribution of Working Group II to the Sixth Assessment Report of the Intergovernmental Panel on Climate Change  Cambridge University Press, Cambridge, UK and New York, NY. https://www.ipcc.ch/report/ar6/wg2/downloads/report/IPCC_AR6_WGII_SummaryForPolicymakers.pdf

We also relied heavily on readings from the Economist magazine.  I have included the links below, but they are behind a paywall. Please check to see if your local library subscribes to this publication. 

Readings from The Economist Magazine:

  1. Staff, 2019. “The past, present, and future of climate change,” The Economist. September 21 [updated Jan 17 2020]. London. https://www.economist.com/briefing/2019/09/21/the-past-present-and-future-of-climate-change 
  2. Staff, 2020. “Why tackling global warming is a challenge without precedent,” The Economist. April 23 [updated May 23 2022]. London. https://www.economist.com/schools-brief/2020/04/23/why-tackling-global-warming-is-a-challenge-without-precedent 
  3. Staff, 2020. “Damage from climate change will be widespread and sometimes surprising,” The Economist. May 16 [updated May 23 2022]. London. https://www.economist.com/schools-brief/2020/05/16/damage-from-climate-change-will-be-widespread-and-sometimes-surprising 
  4. Staff, 2020. “How modelling articulates the science of climate change,” The Economist. May 2 [updated May 23 2022]. London. https://www.economist.com/schools-brief/2020/05/02/how-modelling-articulates-the-science-of-climate-change 
  5. Staff, 2020. “The world urgently needs a price on carbon,” The Economist. May 23. London. https://www.economist.com/briefing/2020/05/23/the-world-urgently-needs-to-expand-its-use-of-carbon-prices 
  6. Shumpeter, 2021. “What if firms were forced to pay for frying the planet?” The Economist. October 9. London. https://www.economist.com/business/2021/10/09/what-if-firms-were-forced-to-pay-for-frying-the-planet 
  7. Staff, 2020. “Climate adaptation policies are needed more than ever,” The Economist. May 30. London. https://www.economist.com/schools-brief/2020/05/30/climate-adaptation-policies-are-needed-more-than-ever 
  8. Staff, 2017. “Climate change and inequality,” The Economist. July 13. London. https://www.economist.com/finance-and-economics/2017/07/13/climate-change-and-inequality 
  9. Staff, 2022. “Do men and women think about climate change differently?” The Economist. July 22. London. https://www.economist.com/graphic-detail/2022/07/22/do-men-and-women-think-about-climate-change-differently 
  10. Staff, 2021. “Maine relies on its marine life, but climate change will alter what that means,” The Economist. October 23. London. https://www.economist.com/united-states/2021/10/23/maine-relies-on-its-marine-life-but-climate-change-will-alter-what-that-means 

Other readings came from McKinsey and Company, Resources for the Future, the Brookings Institute, and others:

  1. McKinsey and Company, 2007. “Reducing US greenhouse gas emissions: How much at what cost?” Executive Summary. https://www.mckinsey.com/capabilities/sustainability/our-insights/reducing-us-greenhouse-gas-emissions.
  2. Hafstead, M., 2019. “Carbon Pricing 101,” Resources for the Future, Washington DC. https://www.rff.org/publications/explainers/carbon-pricing-101/.
  3. Hayes, K. and M. Hafstead, 2020. “Carbon Pricing 103: Effects across sectors,” https://www.rff.org/publications/explainers/carbon-pricing-103-effects-across-sectors/
  4. The Hamilton Project and the Stanford Institute for Economic Policy Research, 2019. Ten Facts about the Economics of Climate Change and Climate Policy. Washington, DC: Brookings Institute. https://www.brookings.edu/wp-content/uploads/2019/10/Environmental-Facts_WEB.pdf
  5. Urpelainen, J. and George, E. 2021. “Reforming Global Fossil Fuel Subsidies”, Washington, DC: Brookings Institution. https://www.brookings.edu/research/reforming-global-fossil-fuel-subsidies-how-the-united-states-can-restart-international-cooperation/
  6. Hu, Ellie. 2022. “The Gendered Impacts of Climate Change” [blog post]. Global Development Policy Center: Economics in Context Initiative. Boston, MA. https://www.bu.edu/eci/2022/05/17/the-gendered-impacts-of-climate-change/ 

We also listened to an eight part podcast entitled “To a Lesser Degree,” also from the Economist. The series was a runup to the COP 26 Conference in Glasgow, Scotland. You can find the entire series here: https://www.economist.com/podcasts/2021/09/25/to-a-lesser-degree-a-climate-podcast-from-the-economist. No subscription required. 

Finally, we listened to two episodes of the podcast “Resources Radio,” from the Washington, DC-based think tank Resources for the Future: 

  1. Raimi, Daniel [host]. 2020. “Which Climate Change Path are We On?” [Audio Podcast Episode]. In Resources Radio, Resources for the Future. Feb 25. https://www.resources.org/resources-radio/which-climate-path-are-we-zeke-hausfather/ 
  2. Hayes, Kristin [host]. 2019. “Carbon Dioxide Removal,” [Audio Podcast Episode]. In Resources Radio, Resources for the Future. April 2. https://www.resources.org/resources-radio/resources-radio-carbon-dioxide-removal-greg-nemet-university-wisconsin-madison/ 

Feel free to email me for more information!

Second Quarter 2022 Journal Round Up!

Second Quarter 2022 Journal Round Up!

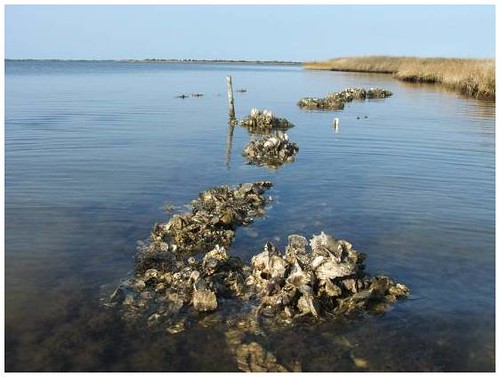
  1. Hynes, et al. 2022. “Estimating the costs and benefits of protecting a coastal amenity from climate change-related hazards: Nature based solutions via oyster reef restoration versus grey infrastructure.” Ecological Economics, vol 194.
Oyster reefs” by USFWS Headquarters is licensed under CC BY 2.0.

While ecologists have known that nature-based solutions to problems like flooding and pollution control are in many cases less expensive and more efficient than human-made solutions, economists have been rather late to the party. A case in point is discovering that so-called “green infrastructure,” like restored wetlands or oyster reefs, can be better in many ways than “gray infrastructure,” or manufactured barriers to wave action. 

This article investigates the recreational value associated with restoring an oyster reef bar that would act as a natural breakwater versus a permanent seawall on a coastal walking trail that is under threat from sea level rise and storm surge. The authors estimated the costs of protecting the walking trail under both scenarios, and found that the benefit-cost ratio of restoring the oyster reef was several times higher than the benefit-cost ratio of the manmade seawall. Moreover, the analysis does not include the positive ecosystem services that the oyster reef could provide above and beyond providing a natural breakwater, such as pollution control or carbon sequestration. 


2. Huang, Yui and Woodward, R. 2022. “Spillover Effects of Grocery Bag Legislation: Evidence of Bag Bans and Bag Fees.” Environmental and Resource Economics (81:711–741) 

This article investigates the unintended consequences of carryout grocery bag regulations by looking at the impact on sales of alternative plastic bags. The unfortunate conclusion of the article is that both the carry out bag ban and the carry out bag fee that they examined led to a significant increase in small plastic trash bag consumption. Whereas previous studies had looked at whether fees on single use plastic bags in grocery stores directly reduced the usage of those bags or increased recycled bag usage, this is one of the first studies to look at the indirect effects of such policies. Their hypothesis is that consumers reuse plastic grocery bags as trash can liners. When those bags either became more expensive or less available, consumers switched to purchasing small trash bags. This article highlights the importance of considering unintended consequences of well-meaning regulations.

Changes to the Census: What it Means to Researchers and Policy Makers

Changes to the Census: What it Means to Researchers and Policy Makers

At rbouvier consulting, we understand how vital Census data is at all levels of society. Not only is decennial Census data used to appropriate seats in the US House of Representatives, state governments, and allocate billions of dollars in federal funding, it’s also vital data used in research across the country that supports both public and private decision making.  

Which is why we’re concerned about changes to the 2022 Census and what it might mean for researchers and policy makers alike.

Challenges of the 2020 Census  

The 2020 Decennial Census was set to face unprecedented challenges even before the COVID-19 pandemic hit. In 2019, Kenneth Prewitt, a Carnegie Professor of Public Affairs and the Special Advisor to the President at Columbia University, spoke out about the 2020 Census and the issues it was expected to face. He addressed the major challenges the decennial census has faced throughout history and the nuanced challenges of the 2020 decennial census.

Since its inception, the census has consistently faced two major challenges: operational issues and partisan interference. Budget constraints and public distrust in the period prior to the COVID-19 pandemic added to those difficulties for the 2020 census. 

The US Census Bureau’s advertising budget for the 2000 and 2010 Censuses was dramatically boosted as a result of the concerningly high and rising non-response rates in the 1990 Census. Due to the success of the Bureau’s advertising activities and the country’s population growth, another budget rise for the 2020 Census was anticipated. Congress, however, decided against approving a budget increase for the 2020 Census. The Census Bureau did manage to offset at least part of its budget constraints by allowing able households to fill out the Census online. It also used administrative records to fill in gaps when respondents choose not to answer certain questions, helping to avoid costly in-person follow-ups to these respondents’ homes. The use of administrative records, however, posed another operational issue to the Bureau: public distrust and privacy concerns, which were more difficult to manage. 

Unsurprisingly, the outset of the pandemic brought about additional operational issues as concerns over health and safety halted all in-person operations. When in-person field operations did resume, the country was experiencing multiple hurricanes and deadly wildfires, and the Census Bureau struggled to find in-field staff due to public health concerns. Additionally, the country saw a mass number of people that were forced to relocate due to both the pandemic and multiple natural disasters, impacting the public’s ability to participate in the Census and the Bureau’s ability to reach certain households. There were a number of actions the Bureau took to mitigate these challenges, such as encouraging online responses and extending in-field operations by two months.2 

Partisan interference is a long-standing tradition of the Census, and the 2020 Census was no exception. Interference in the 2020 Census came in the form of a directive from the Trump Administration to add a citizenship question to the 2020 Census form. The Administration claimed that the directive would assist the US Department of Justice in applying the Voting Rights Act. The directive went against the recommendation of the Census Bureau and sparked a fierce debate. The Bureau held that the question would both increase costs and result in a significant increase in non-response rates about immigrants and non-citizen households. It was expected that, if this question were to be added to the 2020 Census form, major cities with large immigrant populations could lose up to billions in federal funding. Many also feared the addition of a citizenship question would have significant implications for both disaster relief funding and disaster planning. Without an accurate count of the population, planners and emergency responders would struggle with both identifying vulnerable populations and effectively allocating resources. The Trump Administration did ultimately drop its efforts to add a citizenship question due to legal challenges, however, it is possible that the Administration’s efforts had lasting effects on the public’s view of the Census. The heated political debate both increased public concerns about the use of the Census as a government surveillance tool, as well as throwing the topic of the Census into a fiercely politically polarized debate. 

Quality of the 2020 Census 

In March of 2022, the Census Bureau released the results of its analyses of the quality of the 2020 Census. The Census conducts two analyses, a Post-Enumeration Survey (PES) and a Demographic Analysis (DA). Both of these analyses estimate the accuracy with which the Census has counted the nation’s population and population groups. The PES uses a sample survey to estimate the population size while the DA uses vital records and other types of data.  

Nationally, only 0.24% of the entire population was missed in 2020. Some states, however, experienced higher miscounts than others. The map below shows which states had undercounts and overcounts. Six states had undercounts, including Arkansas, Florida, Illinois, Mississippi, Tennessee, and Texas. Arkansas and Tennessee had approximately 5% of their populations missed, about 1 in 20 residents, and undercounts in Florida and Texas cost the state’s congressional seats.3 States that were overcounted include Delaware, Hawaii, Massachusetts, Minnesota, New York, Ohio, Rhode Island, and Utah. Overcounts in Minnesota and Rhode Island have appeared to have gained the states congressional representatives. 

Diagram

Description automatically generated

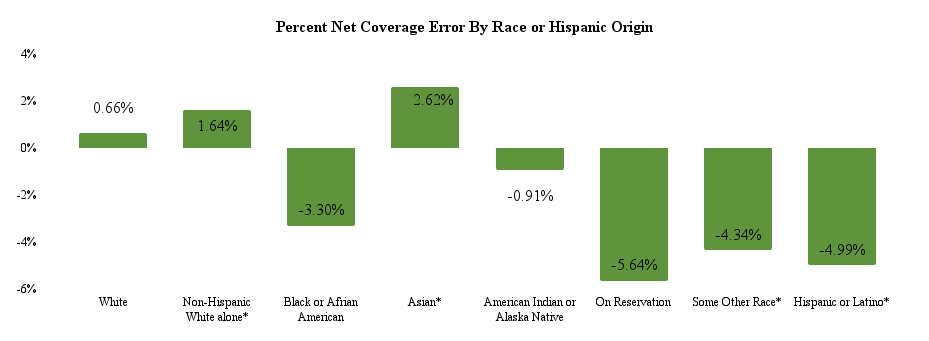
Certain demographic groups were also undercounted and overcounted. By race or Hispanic origin, the Census undercounted those who self-reported as Black, Hispanic or Latino, American Indian or Alaska Native, and “some other race” American Indians or Alaska Natives living on reservations were undercounted at the highest rate. Racial groups that were overcounted include those that reported as non-Hispanic white alone and Asian. When compared with the 2010 Census, groups that were undercounted or overcounted at statistically significant rates include non-Hispanic white alone, black, Asian, some other race, and Hispanic or Latino. 

Source: United States Census Bureau4

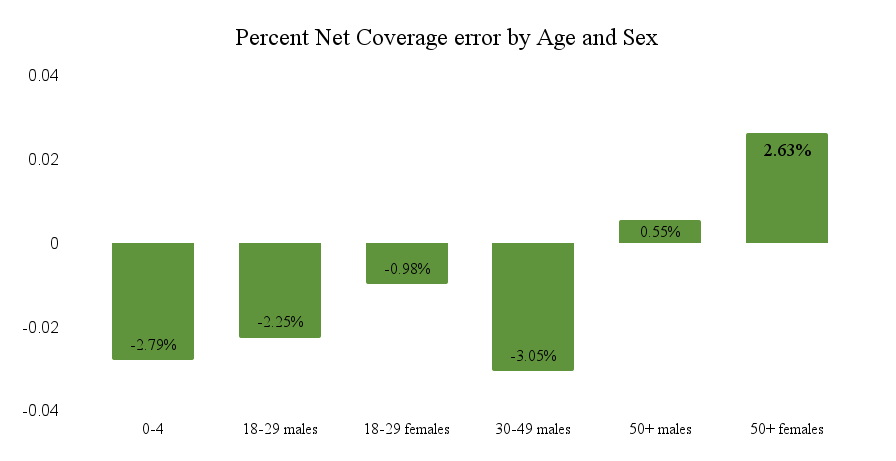
By age and sex, those 50 years and over were overcounted. Children aged 0 to 4, both males and females aged 18 to 29, and males 30 to 49 were undercounted. 

Source: United States Census Bureau5

Additionally, homeowners were overcounted in the 2020 Census by 0.42%, while renters were undercounted by 1.5%.

Many researchers, including us at rbouvier consulting, rely on Census data for accurate information regarding the sociodemographic characteristics of the region we study. While any undertaking as large as the Census is bound to have its issues (and the Census has attempted to rectify some of its prior errors), it is unsettling to see traditionally underrepresented groups continue to be underrepresented. This concern is compounded when we consider “differential privacy,” a practice by which the Census Bureau attempts to preserve the anonymity of residents from small geographic areas, a topic of one of our upcoming blog posts. The decennial Census is one of the best and most reliable sources of sociodemographic statistics we have. Nonetheless, it is worth “ground truthing” it with local results wherever possible.

References

1Prewitt, K. (2019). The 2020 Census: Unprecedented Challenges & Their Implications. American Academy of Arts & Sciences. https://www.amacad.org/news/2020-census-challenges-implications, retrieved on May 19, 2022.

2Jennifer Reichert & Dale Kelly. (2021, March 1). Adapting Field Operations to Meet Unprecedented Challenges. United States Census Bureau. https://www.census.gov/newsroom/blogs/random-samplings/2021/03/unprecedented-challenges.htmll

3Mike Schneider & Associated Press. (2022, May 19). In 2 states, 1 in 20 residents were missed during U.S. Census. PBS News Hour. https://www.pbs.org/newshour/politics/in-2-states-1-in-20-residents-were-missed-during-u-s-census

4,5 United States Census Bureau. (2022, March 10). Census Bureau Releases Estimates of Undercount and Overcount in the 2020 Census [Government]. Census.Gov. https://www.census.gov/newsroom/press-releases/2022/2020-census-estimates-of-undercount-and-overcount.html#:~:text=The%20PES%20found%20that%20the,not%20statistically%20different%20from%20zero

Blog post by – Averi Varney

Rising seas, rising problems: Using locally relevant data to prepare solutions.

Rising seas, rising problems: Using locally relevant data to prepare solutions.

What is a Nor’Easter?

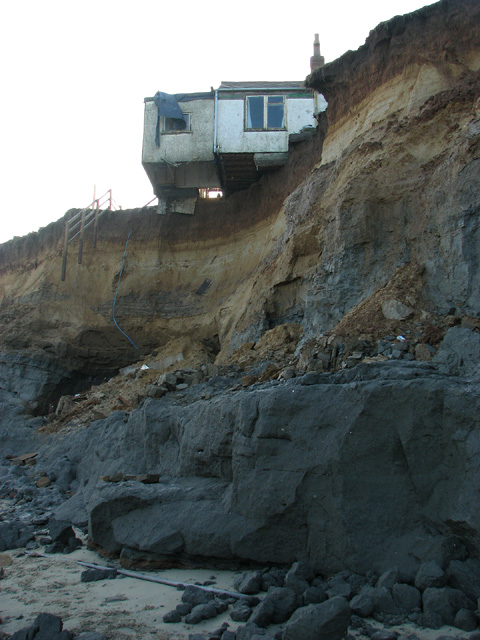
In January of this year, coastal communities on the East Coast were hit with a Nor’easter that set record snow falls in Boston. The storm brought more than just snow, with severe winds, power outages, and flooding. Nor’easters are a type of storm caused by low pressure moving along the coast. Pressures from a storm moving along the coast cause strong winds to push water toward the shore. Some coastal areas in the state were completely underwater around high tide from the storm surge flooding. Waves toppled over seawalls, flooding streets. The island of Nantucket saw the worst of it. There were even reports of young men using a canoe to travel through the flood streets of Nantucket. Storm surge from the nor’easter also caused significant erosion to the beaches along the coast. Local papers in Boston have reported on stories of storm surge erosion cases on Cape Cod where houses fall into the sea. One house in Truro, MA lost twenty 20 feet of Earth underneath it. It was standing on pilons for months as surge after surge eroded the remaining due, as local planning officials tried to decided how to move the historic building. It was moved at the time of this writing.

The Issue 

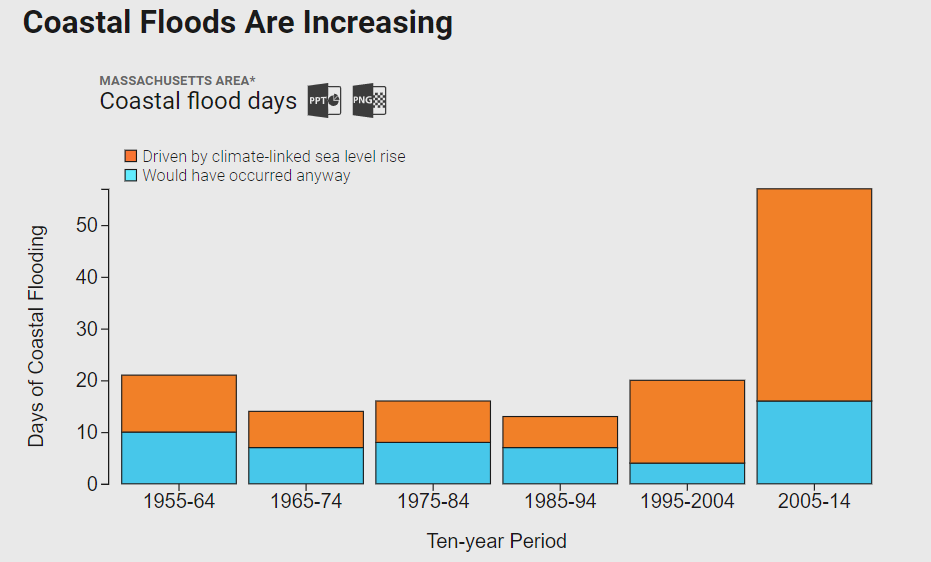
While nor’easters are an event that New England has long been familiar with, climate change has already begun to exacerbate the severity and frequency of these storm events, along with their consequences. Storm events, extreme high tides, and rising seas intensify flooding and put vulnerable communities at risk. The number of coastal flood days in Massachusetts, shown in the graphic below, increased drastically in the last two decades.

Findings from 2016 from at Climate Central study covered by the New York Times, via https://riskfinder.climatecentral.org/state/massachusetts.us?.

Solutions & Our Contributions 

It is becoming increasingly clear how important it is for communities to prepare for a changing climate. As the implications of climate change come to a head, effects will be felt disproportionately across populations, communities, regions, and industries. It’s vital that we assess the areas in which we are vulnerable and are resilient. 

rbouvier consulting recently partnered with the Southern Maine Planning and Development Commission (SMPDC) to assist in their economic resilience planning project for coastal York County, where we were tasked with conducting a socio-economic impact assessment of sea-level rise and storm surge to six coastal communities in southern Maine. 

Geospatial experts from GEI Consultants were also partnered on the project. With capabilities of today’s geospatial technology, GEI Consultants were able to provide us with the physical vulnerabilities of the project area at different sea-level rise and storm surge scenarios. They combined data on businesses, roads, and other important infrastructure with floodplains to produce geospatial layers and other data products that show what of the infrastructure in the area will be impacted at 1.6 and 3.0 feet of sea-level rise.This information allowed us here at rbouvier consulting to determine what culturally and economically significant infrastructure is at risk of flooding or impaired access, such as economic service areas or beaches that draw tourists into Maine. 

Using business-level data on sales revenue and employees, along with data on local demographic and economic conditions, rbouvier consulting was able to assess how sea-level rise will affect output and employment in the area. We determined what industries in the area are most at risk based on the businesses that are within floodplains, and related the risks posed to those industries to the health of the local and regional economies. Conducting a socio-economic impact assessment of sea-level rise tailored to the local conditions of the communities in the project area allowed us to pinpoint areas of economic vulnerability and resilience, and subsequently determine a number of adaptation and mitigation strategies we feel best prepares these communities for a changing climate. 

If you’re interested in talking to rbouvier consulting about climate change solutions and the types of services we offer, please send us an email.

Blog Post by Averi Varney.

Quarterly Journal Review

Quarterly Journal Review

It’s been a while since I’ve shared quarterly journal reviews! In this post I review interesting journal articles from the first three quarters of 2021.

  1. Banerjee, P., Pal, R., Wossink, A., & Asher, J. (2021). Heterogeneity in Farmers’ Social Preferences and the Design of Green Payment Schemes. Environmental and Resource Economics, 78(2), 201–226. https://doi.org/10.1007/s10640-020-00529-7

The first article to catch my attention was Banerjee et al. on the design of green payment schemes.  The article discusses “green payment schemes,” or payment programs designed to give an incentive for farmers to produce “public goods” – to provide more conservation areas, for example, or to practice no-till farming methods to reduce soil erosion. However, the authors point out that typical green payment schemes ignore differences among farmers, and assume that all farmers are solely motivated by profit. Banjeree et al develop a model that takes into account farmers’ different motivations, and the existence of a social norm for environmental preservation. They conclude that coupling a monetary payment with a “social award” would entice more farmers to take advantage of green payment schemes. 

  1. Corona, J., Doley, T., Griffiths, C., Massey, M., Moore, C., Muela, S., Rashleigh, B., Wheeler, W., Whitlock, S. D., & Hewitt, J. (2020). An Integrated Assessment Model for Valuing Water Quality Changes in the United States. Land Economics, 96(4), 478–492. https://doi.org/10.3368/wple.96.4.478

I was also fascinated by an article written by several economists (plus a biologist and an engineer) at the US Environmental Protection Agency. It discusses an integrated assessment model (IAM) to measure the effects of policies designed to improve water quality. (IAMs have been used most popularly to look at the effects of climate change mitigation policy on economic outcomes.) For an economist like me, this model could potentially fill a huge hole. We may know the pathway from an environmental policy to water quality, and we may know some information about the connection between improved water quality to social and economic benefits, but an IAM links the two, making cost-benefit analyses easier to perform and understand. As the authors explain, the modeling platform is designed to quantify the economic benefits of water quality improvements to the nation’s freshwater rivers and streams” (page 479). After describing the model, they apply it to a case study in the mid-western United States. Although the model is still being developed, they hope to make an open source version of it available in the near future. 

  1. Dunning, K. H. (2020). Building resilience to natural hazards through coastal governance: a case study of Hurricane Harvey recovery in Gulf of Mexico communities. Ecological Economics, 12.

Another article that speaks directly to one of the projects that we are working on now is this article, which asks, “how [do] institutions for coastal governance respond to hazards, and how do those responses relate to resilience of human and natural systems?” Essentially, the author’s key takeaway is that higher levels of government take longer than is necessary to respond to disasters. Because of this, she recommends the formation of “sub-national” collaborations, including charity and non-profit groups. While coordination among such groups can be challenging, planning and assigning roles before a disaster strikes can save crucial time, money, and resources.   

  1. Da Rocha, J. M., García-Cutrín, J., Gutiérrez, M.-J., Prellezo, R., & Sanchez, E. (2021). Dynamic Integrated Model for Assessing Fisheries: Discard Bans as an Implicit Value-Added Tax. Environmental and Resource Economics, 80(1), 1–20. https://doi.org/10.1007/s10640-021-00576-8

Switching gears a little to another area that I am interested in and that is relevant to my adopted home state of Maine is this article on banning “discards” in commercial fishing. The “bycatch” issue in commercial fishing has always been a problem: as fishermen are focused on catching high value fish, any fish they catch “incidentally” may be discarded as bycatch. Most of the time, that bycatch does not survive. Several countries have implemented discard bans in various forms. This article examines discard bans using an integrated assessment model (see above). They find that discard bans not only improve the sustainability of a fishery, but can also increase economic welfare in the long run. 

  1. Carlsson, F., Gravert, C., Johansson-Stenma, O., and Kurz, V. 2021. “The Use of Green Nudges as an Environmental Policy Instrument,” Review of Environmental Economics and Policy 15:(2). https://www.journals.uchicago.edu/doi/abs/10.1086/715524

If you follow behavioral economics at all, you’ll recognize the term “nudge.” A “nudge” in terms of economics is defined as “a change in the [decision-making] environment that influences people’s behavior without prohibiting any choices or significantly changing the economic incentives”.* Economics is all about incentives – subsidizing behavior we feel is important or beneficial to society, while taxing those behaviors we feel are harmful to society. A nudge is a bit different – the idea here is that policy makers can change people’s decisions by simply changing the environment within which they make those decisions. Probably the most famous example is that of contributions to retirement accounts, whereby businesses discovered that people contributed more to their retirement accounts if they had to “opt out” (i.e., actively choose not to participate) than when they had to “opt in” (i.e., actively choose to participate. According to standard economic theory, that context should not matter to an individual’s decision-making process. But evidently it does. 

The authors divide green nudges into pure green nudges, and moral green nudges. A pure green nudge simply makes it easier for an individual to choose a more environmentally-friendly option (for example, making the “green energy choice” the default rather than an alternative, or, making the environmentally friendly options more prominent on a menu or in a grocery store). A moral nudge rewards individuals for “doing the right thing” by intentionally triggering a psychological response such as pride or shame. Examples of moral nudges might be moral suasion, social comparisons, or goal setting and commitment. 

Research that compares the effectiveness of green nudges versus more conventional economic policy instruments is still in its early stages, but it is a fascinating area of study. 

* Thaler, R., and C. Sunstein. 2009. Nudge: Improving decisions about health, wealth, and happiness. New York: Penguin.

  1. Gawith, D., Hodge, I., Morgan, F., & Daigneault, A. (2020). Climate change costs more than we think because people adapt less than we assume. Ecological Economics, 173. https://doi.org/10.1016/j.ecolecon.2020.106636

Finally, I was also intrigued by this article, as rbouvier consulting is currently working on a project estimating the economic costs of sea level rise in a county in southern Maine. This article discusses how the current estimates of the cost of climate change may actually be too low, because those costs assume that people will adapt to climate change (for example, planting different crops, changing occupations, or moving locations) if they can. However, literature in behavioral economics (see article above) points out that individuals are much less pliable in their behaviors than traditional economists would like to believe. The model and empirical is rather technical and probably inaccessible to those not familiar with sophisticated environmental and economic modeling. The basic idea though, is simple: because of barriers to behavioral change, individuals may not adapt to climate change as much as economic models assume, and therefore climate change may be even more damaging to the economy than previously thought.     

~ Rachel Bouvier