Category: Economy

Rachel’s Journal Roundup Q3 2022

Rachel’s Journal Roundup Q3 2022

  1. Theine,H.; Humer, S.; Moser, M.; Schnetzer, M. 2022. “Emissions inequality: Disparities in income, expenditure, and the carbon footprint in Austria,” Ecological Economics (197).
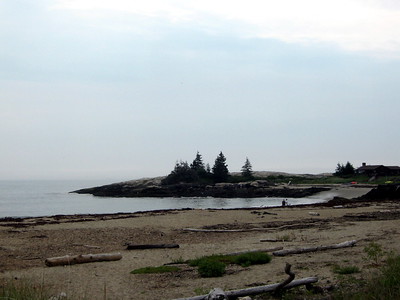
Recently, we completed a project for the Blue Hill Heritage Trust, where we estimated the economic, social, and environmental carrying capacity of the peninsula. One of the issues we considered was the environmental impact of those moving to the area. Like many areas in Maine, the Blue Hill region is seeing an influx of wealthier individuals to the area, primarily due to the rise of remote work. One question that was brought up for us is how households’ environmental impact changed with higher income levels. This article investigates the carbon content of households’ expenditure patterns. They find that the top decile of the income distribution in Austria receives 22% of national income, spends 18% of national expenditure, and causes 17% of emissions. The bottom decile, by contrast, accounts for just 3% of national income, 4% of expenditure, and 4% of emissions. While the article focuses on Austria, results are suggestive for the United States, where income inequality is much larger than it is in Austria. 

While differences in income may explain some of the differences in emissions, they only explain about one third of the difference, implying that the remaining two-thirds of the variation in emissions is attributed to other factors. Not surprisingly, results show that characteristics such as housing stock, heating fuel, and car dependence all contribute to the variation in household carbon emissions. 

These results are not surprising. However, they do bring up a question about the environmental footprint of households moving to Maine (and other places). If, as evidence seems to indicate, higher income people are moving to Maine, it may presage an increase in carbon emissions, based upon these results.  However, the potential good news is that two-thirds of the variation in emissions was due to other factors. If newcomers to Maine reduce their dependence on fossil fuels either by weatherizing or upgrading existing housing stock, they may be able to mitigate some of the increase in emissions coming from increased consumption. If public transportation can be improved in areas that are attracting in-migrants, so much the better. It is possible that an influx of in-migrants will increase carbon emissions. But it is not inevitable.

  1. Kovacs, K.; West, G.; Nowak, D.; Haight, R. 2022. “Tree cover and property values in the United States: A national meta-analysis.,” Ecological Economics (197).
Tree canopy” by Jim Stanton is licensed under CC BY 2.0.

This article explores the relationship between tree coverage and property values. The authors refer to tree coverage as a public good because increased tree coverage in a given area of a neighborhood has been shown to increase value of the homes throughout the entire neighborhood. A representation of this relationship would help municipalities quantify the benefits of community forestry programs. 

The hedonic property value method is a statistical technique that can be used to assess the value of ecosystem services to property. However, these studies are expensive and time-consuming, and oftentimes, local governments are unable to access the resources needed to carry out these analyses. The authors used hedonic property studies conducted in the past to create a benefit transfer tool (whereby multiple hedonic analyses are combined in a meta-analysis) that can be used to measure the value of tree coverage in communities that have not yet conducted hedonic property value analyses. 

Results indicate that where existing tree cover is low, increasing on-property tree density increases property values, while increases in off-property tree cover has no statistically significant effect. In contrast, where tree cover is medium to high,, off -property tree cover has a greater positive effect on property valves than on-property tree cover. This perhaps reflects the belief that high density tree cover on the property is seen as increasing maintenance costs. 

Although the study finds relatively low property value effects, increases in property values are only a small part of the benefits of increased tree cover. The ecosystem services provided by tree cover include air filtration, soil stabilization, flood control, recreation, and habitat provision, as well as aesthetic value. The authors conclude by noting that hedonic property studies can also be used to support open space zoning and green space ordinances.

  1. Mueller, J. 2022. “Natural Resource Dependence and Rural American Economic Prosperity From 2000 to 2015,” Economic Development Quarterly 36(3):160–176. 

This article investigates the role that natural resources play in the economic development of US counties. There are two types of natural resource development: extractive natural resource use, such as oil and gas, mining, and timber, and non-extractive, such as tourism, recreation, and real estate. The author points out that dependence on natural resource development has been shown to be associated with decreases in per capita income, increases in inequality, and elevated poverty in the long term (the so-called “resource curse”). Yet not as much attention has been paid in the literature to the dependence on non-extractive natural resource development. This study aims to correct that, by studying both forms of resource development on economic outcomes in rural counties across the United States. The author makes a distinction between remote rural counties and metro-adjacent rural counties. 

The author finds that the relationship between natural resource development and economic prosperity varies between non-metropolitan remote and nonmetropolitan metro-adjacent counties. Generally speaking, high levels of dependence on either extractive or non-extractive resource development was associated with negative economic outcomes for both remote and metro-adjacent rural counties. However, these relationships were complex. Non-extractive resource development in particular has been promoted in some strands of the literature to have a positive effect on economic outcomes in rural areas. But this work casts doubt on that hypothesis, indicating that non-extractive resource development may actually have a negative effect on the economic outcomes of remote rural counties, perhaps due to the low wages in many of those industries. More work needs to be done in this area.
Is it Time to Use A Different Measure of Economic Well -Being?

Is it Time to Use A Different Measure of Economic Well -Being?

“[Gross domestic product] does not allow for the health of our children, the quality of their education, or the joy of their play. It does not include the beauty of our poetry or the strength of our marriages, the intelligence of our public debate or the integrity of our public officials. It measures neither our courage, nor our wisdom, nor our devotion to our country. It measures everything, in short, except that which makes life worthwhile…” – Robert Kennedy 

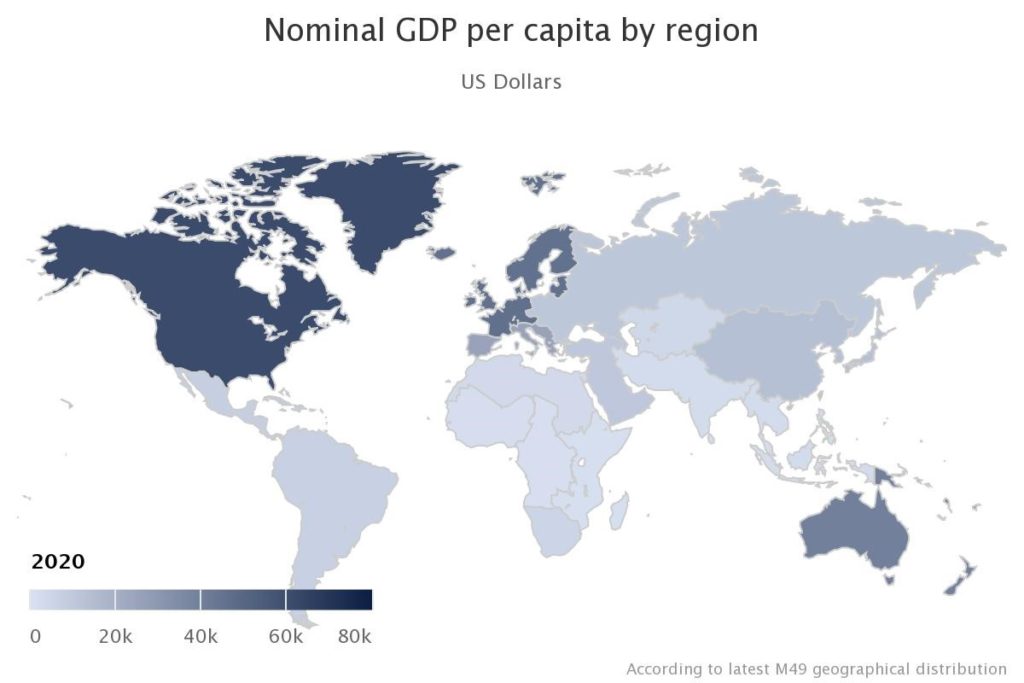
The United States has the largest economy in the world when measured by gross domestic product (GDP).  The World Bank lists the total US GDP at $22.9 trillion, followed by China, $17.7 trillion, and Japan $4.9 trillion. The country’s rank falls to eighth place when we look at GDP per capita.  The US has a GDP per capita of just over $69 thousand which is fairly distant from Luxembourg’s $135 thousand or Ireland’s $99 thousand.1 On the surface these numbers don’t seem all that bad but having a $22.9 trillion dollar economy doesn’t mean that the wealth, and its benefits, are distributed equally or fairly.  

pixabay free images, CC BY-SA 4.0, via Wikimedia Commons 

Life expectancy has dropped two years in row in the United States with a decline of 1.8 years for 2019-2020 and 1.9 years for 2020-2021.2 While much of this is attributed to the Covid-19 pandemic, heart disease, liver disease, and suicide also contributed to the decrease. This decline was not seen in all countries around the world. New Zealand, Taiwan, and Norway all had increases in life expectancy despite the pandemic, and Denmark, Iceland, and North Korea had no change at all during this same time period. 3 With 1 in 10 adults in the US carrying medical debt and many Americans being one injury or illness away from bankruptcy, it comes as no surprise that many people delay needed healthcare out of fear of the cost which likely also contributed to the decline.4 

When we look at other measures of wellbeing the US continues to perform poorly. The US infant mortality rate of 5.9 deaths per 1,000 births is higher than similarly wealthy countries such as France and the UK at 3.8. The US also ranks poorly when measuring income inequality coming in with the 46th highest rate of income inequality out of 162 countries ranked with the Gini index. If you looked at the Gini index more closely, you’d see the US is alongside countries we consider to be a part of the developing world.5  With all of these other indicators pointing towards things not being as rosy as they could be, why is the GDP often seen as the primary measure of a country’s wellbeing?  

The first question we should probably answer is, “What exactly is GDP and what does it measure?” GDP measures the total value of goods and services produced in a particular country over a particular period of time. If a good or service can be bought or sold and those funds can be accounted for, it can be counted as part of GDP. 6 GDP does not count unpaid labor or economic activity that takes place on underground markets.  One example used to demonstrate this is childcare. The time a stay-at-home parent spends caring for their children would not be counted; however if that same parent paid a daycare to care for their child, the funds spent on childcare would be counted. If they paid their teenage neighbor cash to watch their children and those funds are not accounted for in some way, it would also not be counted as part of GDP.  

GDP only measures economic activity without indication as to the source of that activity. For example, if looking at the costs associated with cleaning up a chemical spill at a manufacturing plant, the labor of those working on the cleanup, any equipment purchased, and the money spent on healthcare treatment for those injured by the spill will  be measured as economic activity, without indication as to the cause of that activity. In many cases the costs of such a cleanup may make it appear that there has been an increase in overall economic activity.  GDP would not include intangible losses like soil degradation, loss of wildlife species, or decreased quality of life.  

Back to our initial question, if GDP doesn’t measure wellbeing, why is it so often held up as a measure of it?   

Well, an economist would tell you that it doesn’t measure wellbeing and that it is not meant to but, however those that tally the numbers may intend the figures to be used, this is not how it plays out in the real world. News reporters and politicians will still use GDP as a measure because it is available and most people have at least a vague idea that it measures economic activity.  In addition, numbers that are continually increasing are easy to point to as a measure of things doing well. Finally, there is an assumption that the wealthier a country is the more funds the country has available to spend on things like healthcare, childcare, food, housing, and other things that contribute to the general well-being of the people in a society. But, if we look at the measures above, that is not how these funds are actually used. 

If GDP is not a reliable measure of wellbeing, is there a different measure that would give people a better understanding of just how well a country is doing in taking care of the people who live in it? 

Two well known, and actually used, measures are the Human Development Index (HDI) developed by the United Nations, and the Social Progress Index (SPI), created by the Social Progress Initiative and based on the work of Amartya Sen, Douglass North, and Joseph Stiglitz.7, 8   

The HDI uses human longevity (life expectancy), education, and income (using the GINI index), to measure the well-being of a country.  Using this measure the United States ranked 21st out of 191 countries in 2021.  

The SPI incorporates a total of 53 social and environmental indicators. It is unique in that it uses only non-economic measures to assess wellbeing.  In 2016 the European Union published the first EU Social Progress Index ranking all member countries of the EU, and the Social Progress Initiative published their most recent global rankings in 2021. The measures used include things such as nutrition and basic medical care, water and sanitation access, health and wellness, access to opportunity, human rights, access to education, and other measures.  The United States SPI rank is 24th out of 78 countries assessed in 2021.  

Both HDI and SPI have their criticisms, the primary one being that some of the measures are seen as too subjective, but when looking at what GDP excludes, which is basically everything outside of economic activity, they both provide a better picture of human wellbeing than GDP alone.  

GDP has its place if we are solely looking at economic activity, but we can no longer continue to assume that a country’s high level of overall wealth translates into a higher level of wellbeing for its citizens. If that economic prosperity is not used to increase the health and wellbeing of a population other measures must be used to give a more accurate picture of a nation’s ability and willingness to care for and uplift the people who live in it.  

Post by Joie Grandbois

Addendum to this post by Rachel Lyn Rumson:

In a recent Resources Radio podcast with Margaret Walls called Integrating Nature into US Economic Statistics, with Eli Fenichel (Margaret Walls, Oct, 2022, #206). The show’s guest Eli Fenichel is the Assistant Director for Natural Resource Economics and Accounting in the Office of Science and Technology Policy. He explained that earlier this year the Biden-Harris Administration started a natural capital accounting system that can be folded into the national income and product accounts in the future. We found it refreshing to hear the guest on this podcast say that GDP is problematic on two counts. First, “it does not measure wellbeing” and second, “nature is missing entirely”. Why this is a good step, Fenichel says, is that “now, as we think about making new investments in infrastructure and in nature-based solutions to combat climate change, if we invest in nature, we want it to show up somewhere. Otherwise, it looks like we’re just spending our money, and we’re not.” This new accounting will be annual rather than quarterly and it will roll out in phases over 15 years, the assistant director reported. 

For more information on the actions of the Biden Administration see:

https://www.whitehouse.gov/ostp/news-updates/2022/08/18/readout-ostp-initial-engagement-on-developing-natural-capital-accounts/


[1] https://data.worldbank.org

[2] https://www.cdc.gov/nchs/pressroom/nchs_press_releases/2022/20220831.htm

[3] https://jamanetwork.com/journals/jama/fullarticle/2788128

[4] https://www.minnpost.com/health/2022/08/the-stories-faces-behind-the-100-million-americans-touched-by-medical-debt/

[5] https://www.indexmundi.com/facts/indicators/SI.POV.GINI/rankings

[6] https://www.imf.org/external/pubs/ft/fandd/basics/gdp.htm

[7] https://hdr.undp.org/data-center/human-development-index#/indicies/HDI

[8] https://www.socialprogress.org/index/global

The things we value

The things we value

Graywalls, CC BY-SA 4.0 https://creativecommons.org/licenses/by-sa/4.0, via Wikimedia Commons

As an environmental economics firm, we are often called upon to assign a dollar value to something that doesn’t normally have a price tag assigned to it. This is often a confusing, and sometimes contradictory, idea to many people.  In the United States we live in a culture that tends to equate something’s value in terms of how much it can be sold for. It’s easy enough to say that the value of a forest is in the number of board feet of lumber that would be produced out of it, but that wouldn’t give you the value of the forest’s beauty, or the watershed protection benefits, or the clean air it provides.

To assign a value to these things we might look at the mental and physical health benefits of spending time in a beautiful place; increased mental and physical health can result in decreases in medical costs. A forest’s watershed protection can be measured in the cost savings of reduced levels of water filtration needed for drinking water, and clean air benefits can be seen in reduced rates of lung disease and the associated costs of treating it. And those dollar values can be presented to city councils, congress, or whomever else you might need to convince that protecting forest land has value beyond just the timber in its trees.

While this may be great for trying to persuade your local city council that a patch of forest is worth protecting, it rapidly proves inadequate when looking at the personal, more human value.

How do you put a dollar value on being able to look back on the memory of walking through the woods with your children and being witness to their joyful explorations of the natural world? How do we quantify the opportunities for human connection provided by parks, forests, and other open, and thus safer, spaces during a pandemic? How do we quantify the loss when the spaces in which we created memories, found peace, or took refuge are gone?

A poet might say we measure these things by the space they take up in our hearts or the hole they leave behind when they are gone. But then we aren’t really known for valuing the words of the poets either.

What if we expand beyond forests? How do we put a value on the feeling that comes with having a safe, warm place to live?  Or not having to choose between one’s health and the expense of a medical bill? What is the value of the absence of hunger?

Many of us don’t ever think to put a value on those things because we’ve always been safely housed, had access to medical care, and have never experienced food scarcity. These things have no value to us until we find ourselves without them.

Is the value of a safe place to live measured in the number of nights you go to sleep without worrying where you might sleep tomorrow? Can access to medical care be measured in the years of memories you are able to make, and the stories you can pass on because you lived instead of dying too early?  Is the absence of hunger quantified by the thoughts you are able to think when your brain is not busy figuring out where the next meal comes from, or how to feed your children?

The pandemic has made many of us realize the value of the things we couldn’t put a price on until they were made absent in our lives. Gathering with friends and family, being able to spontaneously hug another person, the enjoyment of previously innocuous activities like sharing a meal together, and a general feeling of being safe in the world. And for a whole lot of people, it was the first time that they experienced the thought that there might not be a tomorrow.  They were only able to assess and quantify things like human connections and what it means to feel safe by their sudden absence.

There is one more step in assigning a value to something, and that is using that value to communicate the need for action. Just as we might use the value of watershed protection to communicate the need for the protection of forests, we can use our new understanding of the value of safety, connection, and hope to advocate for others.  We can remind ourselves that while this feeling was new to us, there are many people who live entire lifetimes where the possibility of tomorrow is not a given.

The value of human experience isn’t measured in a dollar amount but in what we choose to do with it. Let’s make 2022 the year we take what we have learned and use it to make sure that tomorrow is something we all have the opportunity to look forward to.