Category: resiliency

Is it Time to Use A Different Measure of Economic Well -Being?

Is it Time to Use A Different Measure of Economic Well -Being?

“[Gross domestic product] does not allow for the health of our children, the quality of their education, or the joy of their play. It does not include the beauty of our poetry or the strength of our marriages, the intelligence of our public debate or the integrity of our public officials. It measures neither our courage, nor our wisdom, nor our devotion to our country. It measures everything, in short, except that which makes life worthwhile…” – Robert Kennedy 

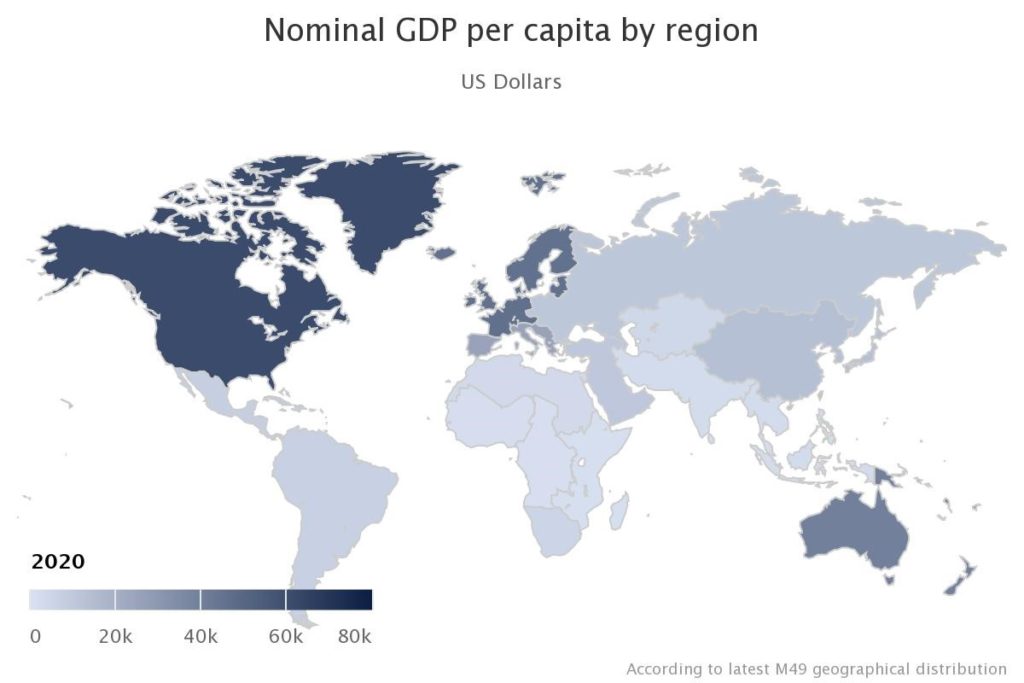
The United States has the largest economy in the world when measured by gross domestic product (GDP).  The World Bank lists the total US GDP at $22.9 trillion, followed by China, $17.7 trillion, and Japan $4.9 trillion. The country’s rank falls to eighth place when we look at GDP per capita.  The US has a GDP per capita of just over $69 thousand which is fairly distant from Luxembourg’s $135 thousand or Ireland’s $99 thousand.1 On the surface these numbers don’t seem all that bad but having a $22.9 trillion dollar economy doesn’t mean that the wealth, and its benefits, are distributed equally or fairly.  

pixabay free images, CC BY-SA 4.0, via Wikimedia Commons 

Life expectancy has dropped two years in row in the United States with a decline of 1.8 years for 2019-2020 and 1.9 years for 2020-2021.2 While much of this is attributed to the Covid-19 pandemic, heart disease, liver disease, and suicide also contributed to the decrease. This decline was not seen in all countries around the world. New Zealand, Taiwan, and Norway all had increases in life expectancy despite the pandemic, and Denmark, Iceland, and North Korea had no change at all during this same time period. 3 With 1 in 10 adults in the US carrying medical debt and many Americans being one injury or illness away from bankruptcy, it comes as no surprise that many people delay needed healthcare out of fear of the cost which likely also contributed to the decline.4 

When we look at other measures of wellbeing the US continues to perform poorly. The US infant mortality rate of 5.9 deaths per 1,000 births is higher than similarly wealthy countries such as France and the UK at 3.8. The US also ranks poorly when measuring income inequality coming in with the 46th highest rate of income inequality out of 162 countries ranked with the Gini index. If you looked at the Gini index more closely, you’d see the US is alongside countries we consider to be a part of the developing world.5  With all of these other indicators pointing towards things not being as rosy as they could be, why is the GDP often seen as the primary measure of a country’s wellbeing?  

The first question we should probably answer is, “What exactly is GDP and what does it measure?” GDP measures the total value of goods and services produced in a particular country over a particular period of time. If a good or service can be bought or sold and those funds can be accounted for, it can be counted as part of GDP. 6 GDP does not count unpaid labor or economic activity that takes place on underground markets.  One example used to demonstrate this is childcare. The time a stay-at-home parent spends caring for their children would not be counted; however if that same parent paid a daycare to care for their child, the funds spent on childcare would be counted. If they paid their teenage neighbor cash to watch their children and those funds are not accounted for in some way, it would also not be counted as part of GDP.  

GDP only measures economic activity without indication as to the source of that activity. For example, if looking at the costs associated with cleaning up a chemical spill at a manufacturing plant, the labor of those working on the cleanup, any equipment purchased, and the money spent on healthcare treatment for those injured by the spill will  be measured as economic activity, without indication as to the cause of that activity. In many cases the costs of such a cleanup may make it appear that there has been an increase in overall economic activity.  GDP would not include intangible losses like soil degradation, loss of wildlife species, or decreased quality of life.  

Back to our initial question, if GDP doesn’t measure wellbeing, why is it so often held up as a measure of it?   

Well, an economist would tell you that it doesn’t measure wellbeing and that it is not meant to but, however those that tally the numbers may intend the figures to be used, this is not how it plays out in the real world. News reporters and politicians will still use GDP as a measure because it is available and most people have at least a vague idea that it measures economic activity.  In addition, numbers that are continually increasing are easy to point to as a measure of things doing well. Finally, there is an assumption that the wealthier a country is the more funds the country has available to spend on things like healthcare, childcare, food, housing, and other things that contribute to the general well-being of the people in a society. But, if we look at the measures above, that is not how these funds are actually used. 

If GDP is not a reliable measure of wellbeing, is there a different measure that would give people a better understanding of just how well a country is doing in taking care of the people who live in it? 

Two well known, and actually used, measures are the Human Development Index (HDI) developed by the United Nations, and the Social Progress Index (SPI), created by the Social Progress Initiative and based on the work of Amartya Sen, Douglass North, and Joseph Stiglitz.7, 8   

The HDI uses human longevity (life expectancy), education, and income (using the GINI index), to measure the well-being of a country.  Using this measure the United States ranked 21st out of 191 countries in 2021.  

The SPI incorporates a total of 53 social and environmental indicators. It is unique in that it uses only non-economic measures to assess wellbeing.  In 2016 the European Union published the first EU Social Progress Index ranking all member countries of the EU, and the Social Progress Initiative published their most recent global rankings in 2021. The measures used include things such as nutrition and basic medical care, water and sanitation access, health and wellness, access to opportunity, human rights, access to education, and other measures.  The United States SPI rank is 24th out of 78 countries assessed in 2021.  

Both HDI and SPI have their criticisms, the primary one being that some of the measures are seen as too subjective, but when looking at what GDP excludes, which is basically everything outside of economic activity, they both provide a better picture of human wellbeing than GDP alone.  

GDP has its place if we are solely looking at economic activity, but we can no longer continue to assume that a country’s high level of overall wealth translates into a higher level of wellbeing for its citizens. If that economic prosperity is not used to increase the health and wellbeing of a population other measures must be used to give a more accurate picture of a nation’s ability and willingness to care for and uplift the people who live in it.  

Post by Joie Grandbois

Addendum to this post by Rachel Lyn Rumson:

In a recent Resources Radio podcast with Margaret Walls called Integrating Nature into US Economic Statistics, with Eli Fenichel (Margaret Walls, Oct, 2022, #206). The show’s guest Eli Fenichel is the Assistant Director for Natural Resource Economics and Accounting in the Office of Science and Technology Policy. He explained that earlier this year the Biden-Harris Administration started a natural capital accounting system that can be folded into the national income and product accounts in the future. We found it refreshing to hear the guest on this podcast say that GDP is problematic on two counts. First, “it does not measure wellbeing” and second, “nature is missing entirely”. Why this is a good step, Fenichel says, is that “now, as we think about making new investments in infrastructure and in nature-based solutions to combat climate change, if we invest in nature, we want it to show up somewhere. Otherwise, it looks like we’re just spending our money, and we’re not.” This new accounting will be annual rather than quarterly and it will roll out in phases over 15 years, the assistant director reported. 

For more information on the actions of the Biden Administration see:

https://www.whitehouse.gov/ostp/news-updates/2022/08/18/readout-ostp-initial-engagement-on-developing-natural-capital-accounts/


[1] https://data.worldbank.org

[2] https://www.cdc.gov/nchs/pressroom/nchs_press_releases/2022/20220831.htm

[3] https://jamanetwork.com/journals/jama/fullarticle/2788128

[4] https://www.minnpost.com/health/2022/08/the-stories-faces-behind-the-100-million-americans-touched-by-medical-debt/

[5] https://www.indexmundi.com/facts/indicators/SI.POV.GINI/rankings

[6] https://www.imf.org/external/pubs/ft/fandd/basics/gdp.htm

[7] https://hdr.undp.org/data-center/human-development-index#/indicies/HDI

[8] https://www.socialprogress.org/index/global

Fourth quarter 2021 and first quarter 2022 journal roundup!

Fourth quarter 2021 and first quarter 2022 journal roundup!

This quarter, I focus on three recently published articles that highlight the value of environmental goods and services: regulations to combat the emerald ash borer, the value of agricultural land, and the value of wetland restoration. 

Hope, Emily; McKenney, Daniel; Pedlar, John; Lawrence, Kevin; MacDonald, Heather. 2021. “Canadian efforts to slow the spread of Emerald Ash Borer (Agrilus planipennis Fairmaire) are economically efficient.” Ecological Economics, vol. 188. 

Emerald ash borer” by NatureServe is marked with CC BY-NC 2.0, via Openverse.

The emerald ash borer is an invasive insect that kills most species of ash tree. Managing the spread of the pest can be very expensive, with inconsistent results. The United States Department of Agriculture has actually removed federal regulations designed to slow the spread of the emerald ash borer, citing the high costs and the uncertain benefits. Canadian agencies have likewise been attempting to determine whether the benefits of regulation exceed the cost. The authors developed a model simulating the spread of the emerald ash borer under various conditions, and then modeled the likely effect of different regulations on that spread. Finally, they determined the economic impact of the emerald ash borer by calculating the cost of removing trees in urban areas and replacing 50% of them. (They did not model the cost of insecticide application due to the complexity of modeling such application at a national level.) For rural areas, the authors calculated the cost of the emerald ash borer by using the stumpage value of the trees. 

Regulations designed to slow the spread of the emerald ash borer include limitations on transporting products containing wood from ash trees, treatments for products that are transported, and periodic audits. As the “true” efficacy of the regulations is unknown, the authors modeled the regulations at varying levels of efficacy. Finally, they then determined the net present value of the regulations. Results demonstrate that, even if regulations are only 25% effective at slowing the spread of the emerald ash borer, benefits outweigh the costs. This is the case even though the authors did not include the economic value of a healthy forest. If that were included, the benefits of those regulations would likely be much larger.

Agricultural landscape certification as a market-driven tool to reward the provisioning of cultural ecosystem services

Borrello, M.; Cecchini, L.; Vecchio, R.; Caracciolo, F.; Cembalo, L.; Torquati, B. 2022. Ecological Economics vol 193. 

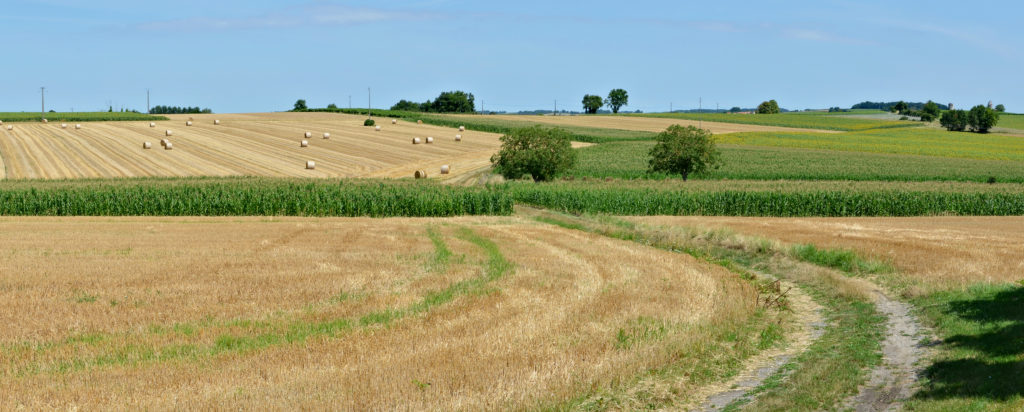
File:Bessac 16 Polyculture 2013.jpg” by JLPC is marked with CC BY-SA 3.0.

One of the primary difficulties that agricultural landowners face is the high cost of keeping their land in agriculture, relative to other land uses. And yet, agricultural land provides benefits to society beyond just the value of the food produced on that land. It is a classic example of an environmental externality. This article examines the potential of issuing a “traditional agricultural landscape certification” for the preservation of olive groves in Italy. They found that such a certification commanded a price premium in the market, indicating that the cost to farmers of keeping their land in agriculture could be partially rewarded through the market. 

Richardson, M.; Liu, P.; Eggleton, M. 2022. “Valuation of Wetland Restoration: Evidence from the Housing Market in Arkansas,” Environmental and Resource Economics 81:649–683.

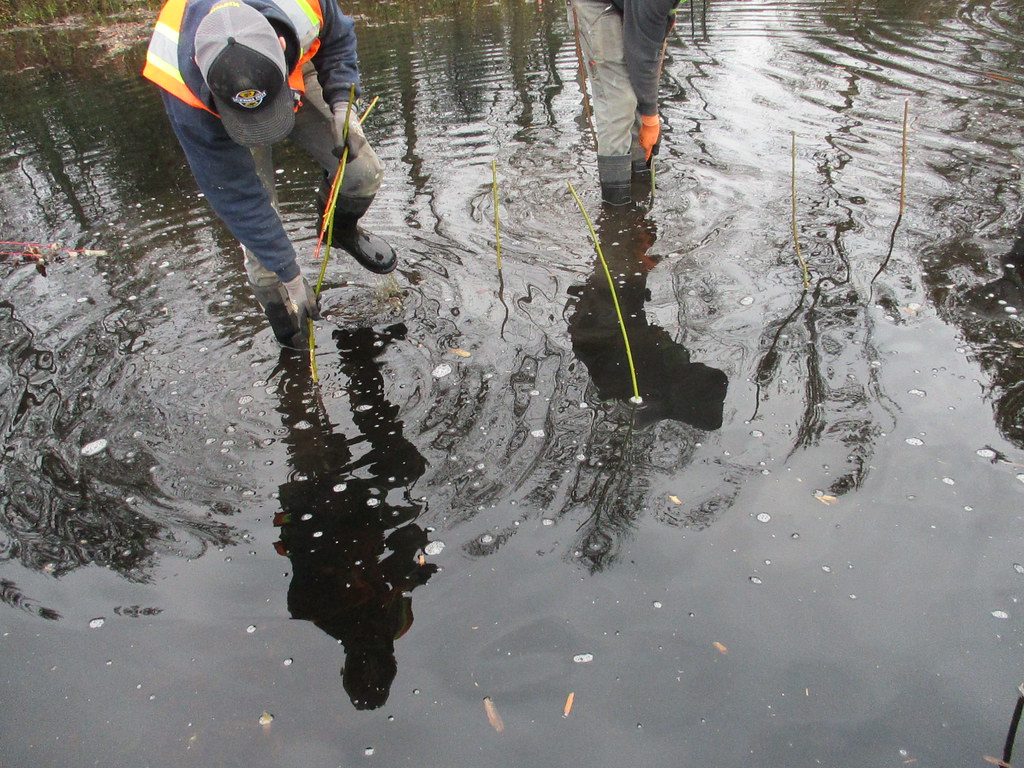
Planting live stakes in standing water” by WSDOT is marked with CC BY-NC-ND 2.0.

Continuing with the theme of valuing environmental goods and services, this article examined the value of wetland restoration (through the Wetland Reserve Program) by looking at the housing market in Arkansas. This article adds to the literature on the economic value of wetlands by looking at temporal variations in the housing market relative to the starting and ending date of wetland restoration projects. Therefore, rather than looking at the value of an already existing wetland, this article examines how improvements in wetland quality could impact surrounding property values. Their research finds a substantial increase in property values – an average of 6 to 10%!  They also find that the wetland size and type were likely to influence the magnitude of the effect, with forested wetlands having a larger positive impact on housing values than pond, lake, or emergent wetlands. Interestingly, open water wetlands had a much smaller effect than non-open water wetlands. The reasons why are unclear.

Infrastructure: It’s more than roads and bridges

Infrastructure: It’s more than roads and bridges

John Buie, CC BY 2.0 https://creativecommons.org/licenses/by/2.0, via Wikimedia Commons

Infrastructure seems to be the word of the hour. With Democrats and Republicans having spent a good portion of the year wrangling over the size and scope of the infrastructure plan, it seems that everyone is talking about it. But we at rbouvier consulting have a slightly different perspective on what the term “infrastructure” includes.

Most people think about infrastructure from a physical or manufactured perspective: roads, bridges, transportation systems, and the like. From an economist’s standpoint, infrastructure also includes the necessities of a well-functioning market: clearly defined private property rights, a robust and transparent legal system, a structure to support the flow of information, and even trust among market participants. 

Environmental and natural resource economists expand the definition of infrastructure to include natural capital: assets provided by nature that support and provide ecosystem services: carbon sequestration, soil stabilization, natural flood control, water filtration, and the like. Just like manufactured infrastructure, natural infrastructure provides the underpinnings of a well-functioning economy. Even more so than manufactured infrastructure, natural infrastructure is almost invisible, only coming to our attention when it fails. 

Part of this is because of the “public good” nature of infrastructure. Much infrastructure (though not all) is characterized by two qualities: non-excludability and non-rivalness. Non-excludability means that once the good is provided, it is very difficult to “exclude” others from partaking of that good. Non-rivalness means that once the good is provided, one more user can enjoy the good without affecting others’ use of the good. The difficulty here is that private companies have no incentive to provide goods with such characteristics. You cannot use the price to exclude people from participating in the good, and one more user does not affect others’ use of the good, both of which destroy the profit motive. That is why many public goods are provided by the government – think national defense, or the national highway system. (The highway system can be thought of as a congestible good: non-rival up to a certain point. Most goods run on a spectrum from pure private goods to pure public goods.)

Natural infrastructure faces a double whammy: not only is most natural infrastructure characterized by non-rivalness and non-exclusivity, it is also seen as freely provided by nature. In our market-based society, things that are seen as freely available are also likely undervalued. In turn, things that are undervalued are not well managed. Just like physical infrastructure, natural infrastructure can be degraded or even destroyed. But by taking account of the services provided by natural infrastructure, we can make better decisions that will improve the functioning of our economy, and save us a little money at the same time. 

Infrastructure can be roughly divided into two types: green infrastructure and gray infrastructure. Green infrastructure is what I have been referring to as natural infrastructure, while gray infrastructure is manufactured infrastructure. In many cases, natural infrastructure can provide the same service as gray infrastructure, while providing other environmental benefits and avoiding environmental costs.

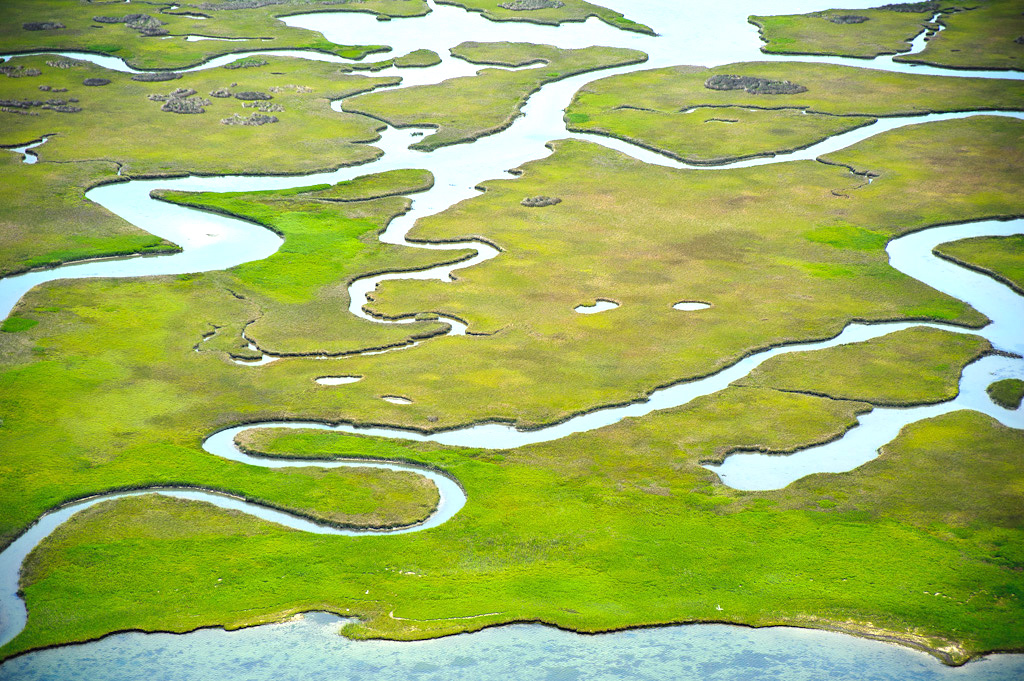
Think about flood control. Part of the reason why recent hurricanes have become more economically costly in the past few decades is because the natural wetlands – the marshy interface between the ocean and the land – had been destroyed or degraded. Recently, there has been a lot of interest in restoring wetlands to protect property from storm surges that come from hurricanes or other storms. Not only would restoring those wetlands provide flood control services, but they also could provide other ecosystem services in the form of habitat for aquatic creatures and other sea life.    

Or, take stormwater filtration. One of the recent projects that we are working on here at rbouvier consulting is about nutrient pollution: excess nitrogen and phosphorus pollution from farms and urban runoff. Excess nutrients in water bodies can cause hypoxia, or “dead zones,” where algae growth from too many nutrients can lead to depleted oxygen levels in water.  Some states are allowing municipalities to receive “credits” for nutrient pollution reduction by restoring formerly degraded wetlands, which allows those wetlands to trap and filter out pollutants before they reach the river, ocean, or bay. 

Finally, some drinking water utilities are purchasing forested land in their watershed. By investing in this natural capital, water utilities may be able save on expensive filtration processes through the forests’ natural filtration services.      

Green infrastructure is not always a substitute for gray infrastructure; in many cases, it can be a complement to it. Regardless, the infrastructure bill that emerges from Congress should pay attention to both kinds of infrastructure: green and gray.

The Rising Cost of Hurricanes

The Rising Cost of Hurricanes

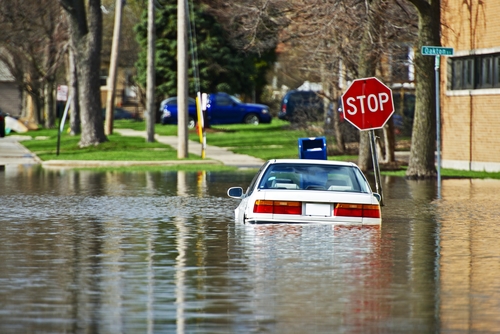
The hurricane season of 2017 has been a severely damaging one. Hurricane Harvey devastated parts of Texas, Maria savaged Puerto Rico, and Hurricane Irma dealt a punishing blow to an already-reeling Florida (not to mention Nate and Jose). As I write this, Hurricane Ophelia – the tenth named storm in a season that was predicted to be “less active than usual” – is brewing in the eastern Atlantic. Whatever the cause of this increase in hurricane frequency, though climate change is a likely culprit, no one can deny that these storms are growing more costly

The World Health Organization estimates that the global cost of hurricane damage per season is rising by 6% a year. (That’s in real dollars, not nominal, by the way, so inflation doesn’t factor into it.) If storms are increasing in strength and frequency, why is more not being to mitigate the costs?

Two words: incentives and avoidance.

Economists believe that people respond to incentives. Make an activity less expensive, and more people will engage in it. Make an activity more expensive, and the level of activity will drop off. Why is that important here?

It turns out that if policy makers make it relatively inexpensive to build your house in a floodzone, lo and behold, more people are going to build their houses in floodzones. Houses that are built in floodzones are, no big surprise, more prone to flooding. According to the Economist magazine’s recent article, Harris County, Houston’s home, has allowed 8,600 homes to go up in the 100-year floodplain. (The 100 year floodplain is not, despite its name, an area where a flood is expected to occur every 100 years. A 100 year floodplain is an area that has a 1 percent chance of being flooded in any given year. That means, over the life of a 30-year mortgage, the change of a such a flood occurring is just about 26 percent.) The more houses located in a floodplain, the greater the expected cost of such a flood. Simple math.

Not only that, but by developing in the floodplain, much of that land was converted from prairie land to impermeable surfaces, like roads, driveways, and sidewalks. Coastal prairie land can absorb large amounts of rainfall. Concrete and asphalt cannot, leading to more flooding and more runoff, and more erosion of existing soil, as the velocity of the water is increased by those impermeable surfaces. The act of putting more development in vulnerable areas is a double whammy – you’re putting more homes in harm’s way, and you’re taking away the natural infrastructure that helps protect against flooding in the first place.

I also mentioned “avoidance” as one of the reasons why hurricane costs have been increasing. It’s no surprise that most people tend to avoid thinking about negative information, and that applies to getting insurance. According to the Insurance Information Institute, only 12 percent of American homeowners had flood insurance in 2016. While most banks and mortgage companies require flood insurance if your home is in a high-risk area, federal law does not require coverage in a moderate to low risk area and almost 25% of all flood-related claims come from those areas. Why is that? Maybe they see it as too expensive, or they’re putting it off. Maybe they’ve simply made a bad bet. Or perhaps they expect the federal government to foot the bill. Even if the government does cover some of the damage (and the federal government did cover about 80% of Hurricane Katrina’s damages), that still means that taxpayers may be subsidizing an increasingly risky bet.

And those bets are becoming riskier. What was once considered a 100-year storm – that is, where the probability of one occurring is one percent annually – is now occurring more frequently. Scientists estimate the likelihood of a storm of a certain size occurring based on historical figures – and we know that more intense storms are happening more often. (For a great discussion of how the US Geological Survey draws the “flood maps,” see this piece from Five Thirty Eight.)

It’s not only the insurance companies, the homeowners, or the federal government who shoulders the increasing costs of hurricanes and other natural disasters. Municipalities can see a blow to their tax base, a rise in the cost of borrowing, and even the possibility of litigation if it’s found that the municipality issued building permits or approving subdivisions that increase the potential of flooding.

What can be done to stop these costs from continuing to increase? Well, for a starter, communities need to take a good long look at their land use regulations. We need to stop subsidizing bad risks. It should be more, not less, costly to build in flood plains. We need to stop subsidizing the conversion of wetlands and other buffer zones to development. We need to preserve our natural infrastructure. And, we need to implement more resiliency efforts.

Municipalities should also make sure that businesses and homeowners fully understand the potential costs of not having flood insurance We need to make sure that the people involved in these kinds of decisions have a clear understanding of the full social and environmental costs of their actions. These moves make economic sense as well as environmental sense.

rbouvier consulting’s mission is to promote a more transparent economy by making sure that social and environmental costs are included in economic decisions. Visit our website to find out more.

Economic Resiliency in the Face of Climate Change

Economic Resiliency in the Face of Climate Change

gardiner-flood-300x171

Climate change is expected to have a number of effects in Maine, including coastal flooding, sea level rise, and changing precipitation patterns, among others.  Many efforts are already underway to help protect communities from those effects, including zoning changes, new building requirements, armoring or elevating critical infrastructure, and the like. These efforts all fall under the heading “climate resiliency planning,” as they make a community more resilient to the disruptions wrought by changing weather patterns.

Ensuring that a local economy is resilient to climate disruption is nearly as important as physical resiliency. The local economy is a complex web of interactions between customers, workers, businesses, non-profits, and government agencies within the region. Economic resiliency planning can help to make sure that that web does not break – or, at least, is easily rebuilt – after a disaster.

Current approaches to assessing the impact of climate change too often ignore economic changes that are likely to occur.  Climate change poses physical threats to current businesses, true, but it also poses economic ones, as supply chains dry up, input prices rise, or competitive advantages shift. Focusing on preserving the economic status quo will do little good if advancing sea level rise and increasingly variable weather patterns result in a markedly changed economic landscape.

The first step in developing an economic resiliency plan for a local economy is to anticipate the likely physical changes that will accompany climate change, by taking a look at what areas of a particular municipality are likely to be impacted by certain events.  If you’re located on the coast, or if your town center is situated near a river, as is the case for many Maine towns, flooding from hurricanes or other large storms might be a priority.  Or, access may be more of an issue.  If your town has one or two main routes in and out of town, how likely are these routes to be block by high water, or by downed trees from wind damage? Many communities have already begun this work, through projections from the National Oceanic and Atmospheric Administration (NOAA) or from the United States Environmental Protection Agency.  Through this work, communities can get an idea of what physical assets are at risk from climate-related events.

Next, establish a baseline.  What are the largest employers in the municipality? What are the largest sources of tax revenue? What are the key industries, and what is the sectoral composition of the economic base? Where do most of the non-resident employers live, and what routes are they likely to take to work?  This will create a starting point to assess the local economy’s vulnerability to climate-related disruption.  The results may not always be what you think.

For example, many of Maine’s historically most important industries – agriculture, forestry, fishing, and tourism – depend heavily on the climate.  The output from these industries is likely to be directly impacted by any climate disruptions.  Agriculture, for example, could be both positively and negatively affected by climate change, as higher temperatures lead to a longer growing season, but also to increased need for irrigation.  These are the industries that are deemed “climate-sensitive in supply” by economists.

But there are also industries that are “climate-sensitive in demand” – where consumer demand for goods and services is likely to be affected by changing weather patterns or the physical effects that come with them.  Tourism, certainly, is one of these (both positively and negatively).  Energy is another.

Less obvious, perhaps, are the effects of underlying price changes and linkages between industries.  Let’s give an example.  Suppose that an increase in hot, humid weather in the northeast leads to increased demand for air-conditioning.  (Most areas in Maine now see fewer than four days a year when the heat index rises above 95 F, but that is predicted to change under most projections.)  The increased demand for air-conditioning will likely lead to increased electricity prices.  Those higher prices will ripple through the economy, affecting everything from family’s budgets to food prices to costs to businesses.

Finally, labor productivity might be affected by climate change.  Why? For those of us who have jobs in air-conditioned buildings, and as such are relatively shielded from the climate, the outdoor temperature might not affect our productivity.  But for the proportion of Maine workers who work outside, or do not have access to air conditioning, heat-related stress can be a factor, much as it is for livestock in Maine. Moreover, the effect of warmer temperatures on growing seasons works for pollen-producing plants as well, leading to increased rates of asthma and allergies. The spread of insect-borne diseases, such as Lyme, may affect productivity as well (not to mention impacting the health care sector).

Once the likely changes to the local economy are anticipated, policies can be put in place to help reduce risks.  Some of these policies might include encouraging local businesses to engage in disaster preparedness with others rather than in isolation, developing a directory of local businesses that can assist in rebuilding after a disaster, and identifying alternative procurement routes in case of a disruption in transportation infrastructure.

Planning for economic resiliency is less about rebuilding the day after a disaster, and more about planning so that economic disruptions are minimized should a disaster occur.  And it doesn’t have to be a stand-alone process.  In fact, it shouldn’t be.  Planning for economic resiliency should be integrated into planning efforts at all levels, from economic development to housing and infrastructure planning. While a disaster almost by definition is unpredictable, we do have the ability to anticipate the changes that will come with a changing climate.  We should take the time now to ensure that those changes don’t derail the local economy.

*Photo Credit: Maine Emergency Management Agency. Flooding in Gardiner, Maine. 2013.